Department of Applied Physics
A Quick Guide
2AS00 - Statistical Data-Analysis
N. M. C. van Acht 1236264
June 21, 2019
1
,Contents
1 Exploratory Data Analysis (EDA) 3
2 Distributions & Probability Calculations 4
2.1 The Normal/Gaussian Distribution . . . . . . . . . . . . . . . . . . . . . . . . . . . . . . . 4
2.2 The Binomial Distribution . . . . . . . . . . . . . . . . . . . . . . . . . . . . . . . . . . . . 4
2.3 The Poisson Distribution . . . . . . . . . . . . . . . . . . . . . . . . . . . . . . . . . . . . 5
3 Testing & Estimations 6
3.1 Student T-Distribution & Testing . . . . . . . . . . . . . . . . . . . . . . . . . . . . . . . . 6
3.2 Chi-Squared . . . . . . . . . . . . . . . . . . . . . . . . . . . . . . . . . . . . . . . . . . . . 6
3.3 Hypothesis Testing . . . . . . . . . . . . . . . . . . . . . . . . . . . . . . . . . . . . . . . . 6
4 Regression Modeling 7
4.1 Linear Regression Modeling . . . . . . . . . . . . . . . . . . . . . . . . . . . . . . . . . . . 7
4.1.1 Testing the Linear Regression Model . . . . . . . . . . . . . . . . . . . . . . . . . . 7
4.2 Other Regression Models . . . . . . . . . . . . . . . . . . . . . . . . . . . . . . . . . . . . 8
5 Analysis of Variance (ANOVA) 9
5.1 One Way ANOVA . . . . . . . . . . . . . . . . . . . . . . . . . . . . . . . . . . . . . . . . 9
5.2 Multiple way ANOVA . . . . . . . . . . . . . . . . . . . . . . . . . . . . . . . . . . . . . . 9
A Appendix 11
A.1 Examples . . . . . . . . . . . . . . . . . . . . . . . . . . . . . . . . . . . . . . . . . . . . . 11
A.2 Figures & Tables . . . . . . . . . . . . . . . . . . . . . . . . . . . . . . . . . . . . . . . . . 14
2
, 1 Exploratory Data Analysis (EDA)
Exploratory Data Analysis is a way of exploring data promoted by Tukey. The key features of EDA
are:
• Getting to know the data
• Extensively using graphs
• Generating questions
• Detecting errors in data
The easiest way to compute this is by creating an EDA table. Such a table describes the key features of
the data provided. Such an EDA table can be seen below in table 1.
Table 1: Exploratory Data Analysis table.
What Specific Remarks
Sample size Number of N Small vs. big
Location Mean/Median Approximately equal or totally different
Extremes Minimum/Maximum Far apart or close to each other
Dispersion SD/IQR Small vs. big
Symmetry Skewed Look at figures
Normality Deviations QQ-plot/Shapiro Wilk (p > α)
Outliers Yes or no Relation with sample size
Others - -
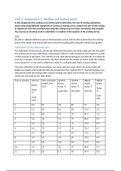
The most used representations are: stripcharts, histograms, density estimates and boxplots.
These are shown in figure 1.
Figure 1: In these figures a stripchart, histogram, density estimate and boxplot are shown in which the
MPG of cars on the highway are visible.
3
A Quick Guide
2AS00 - Statistical Data-Analysis
N. M. C. van Acht 1236264
June 21, 2019
1
,Contents
1 Exploratory Data Analysis (EDA) 3
2 Distributions & Probability Calculations 4
2.1 The Normal/Gaussian Distribution . . . . . . . . . . . . . . . . . . . . . . . . . . . . . . . 4
2.2 The Binomial Distribution . . . . . . . . . . . . . . . . . . . . . . . . . . . . . . . . . . . . 4
2.3 The Poisson Distribution . . . . . . . . . . . . . . . . . . . . . . . . . . . . . . . . . . . . 5
3 Testing & Estimations 6
3.1 Student T-Distribution & Testing . . . . . . . . . . . . . . . . . . . . . . . . . . . . . . . . 6
3.2 Chi-Squared . . . . . . . . . . . . . . . . . . . . . . . . . . . . . . . . . . . . . . . . . . . . 6
3.3 Hypothesis Testing . . . . . . . . . . . . . . . . . . . . . . . . . . . . . . . . . . . . . . . . 6
4 Regression Modeling 7
4.1 Linear Regression Modeling . . . . . . . . . . . . . . . . . . . . . . . . . . . . . . . . . . . 7
4.1.1 Testing the Linear Regression Model . . . . . . . . . . . . . . . . . . . . . . . . . . 7
4.2 Other Regression Models . . . . . . . . . . . . . . . . . . . . . . . . . . . . . . . . . . . . 8
5 Analysis of Variance (ANOVA) 9
5.1 One Way ANOVA . . . . . . . . . . . . . . . . . . . . . . . . . . . . . . . . . . . . . . . . 9
5.2 Multiple way ANOVA . . . . . . . . . . . . . . . . . . . . . . . . . . . . . . . . . . . . . . 9
A Appendix 11
A.1 Examples . . . . . . . . . . . . . . . . . . . . . . . . . . . . . . . . . . . . . . . . . . . . . 11
A.2 Figures & Tables . . . . . . . . . . . . . . . . . . . . . . . . . . . . . . . . . . . . . . . . . 14
2
, 1 Exploratory Data Analysis (EDA)
Exploratory Data Analysis is a way of exploring data promoted by Tukey. The key features of EDA
are:
• Getting to know the data
• Extensively using graphs
• Generating questions
• Detecting errors in data
The easiest way to compute this is by creating an EDA table. Such a table describes the key features of
the data provided. Such an EDA table can be seen below in table 1.
Table 1: Exploratory Data Analysis table.
What Specific Remarks
Sample size Number of N Small vs. big
Location Mean/Median Approximately equal or totally different
Extremes Minimum/Maximum Far apart or close to each other
Dispersion SD/IQR Small vs. big
Symmetry Skewed Look at figures
Normality Deviations QQ-plot/Shapiro Wilk (p > α)
Outliers Yes or no Relation with sample size
Others - -
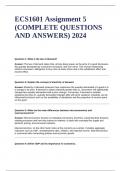
The most used representations are: stripcharts, histograms, density estimates and boxplots.
These are shown in figure 1.
Figure 1: In these figures a stripchart, histogram, density estimate and boxplot are shown in which the
MPG of cars on the highway are visible.
3