Therapeutic index
Author: Flavio Guzman, MD.
The concept of therapeutic index refers to the relationship between toxic and
therapeutic dose. This pharmacodynamic parameter is relevant to clinical practice
because it determines how safe (or toxic) a drug is.
Article outline:
Therapeutic index equation
How therapeutic index is determined
List of narrow therapeutic index drugs
Therapeutic index equation
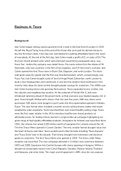
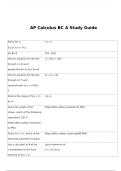
The therapeutic index of a drug is the ratio of the dose that produces toxicity to the
dose that produces a clinically desired or effective response in a population of
individuals.
Where: TD50 is the dose of drug that causes a toxic response in 50% of the population
and ED50 is the dose of drug that is therapeutically effective in 50% of the population.
How therapeutic index is determined
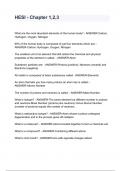
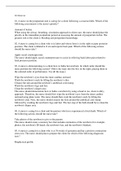
Therapeutic index and quantal dose response curves
Both ED50 and TD50 are calculated from quantal dose response curves, which
represent the frequency with which each dose of drug elicits the desired response or
toxic effect in the population.
, There are some important characteristics of quantal dose-response curves (see image
above) that are worth noting:
Dose of drug in plasma is plotted in the horizontal axis while the percentage of
individuals (animals or humans) that responds or shows a toxic effect is represented in
the vertical axis.
These curves measure all or none (positive or negative) responses. Some
examples of positive responses include: relief of headache for an antimigraine drug,
increase in heart rate of at least 20 bpm for a cardiac stimulant, or 10 mmHg fall in
diastolic blood pressure for an antihypertensive.
Data is obtained from a population. Unlike graded dose-response graphs,
data for quantal dose-response curves is obtained from many individuals.
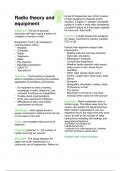
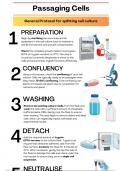
ED50
The graph below shows how ED50 is calculated.
Author: Flavio Guzman, MD.
The concept of therapeutic index refers to the relationship between toxic and
therapeutic dose. This pharmacodynamic parameter is relevant to clinical practice
because it determines how safe (or toxic) a drug is.
Article outline:
Therapeutic index equation
How therapeutic index is determined
List of narrow therapeutic index drugs
Therapeutic index equation
The therapeutic index of a drug is the ratio of the dose that produces toxicity to the
dose that produces a clinically desired or effective response in a population of
individuals.
Where: TD50 is the dose of drug that causes a toxic response in 50% of the population
and ED50 is the dose of drug that is therapeutically effective in 50% of the population.
How therapeutic index is determined
Therapeutic index and quantal dose response curves
Both ED50 and TD50 are calculated from quantal dose response curves, which
represent the frequency with which each dose of drug elicits the desired response or
toxic effect in the population.
, There are some important characteristics of quantal dose-response curves (see image
above) that are worth noting:
Dose of drug in plasma is plotted in the horizontal axis while the percentage of
individuals (animals or humans) that responds or shows a toxic effect is represented in
the vertical axis.
These curves measure all or none (positive or negative) responses. Some
examples of positive responses include: relief of headache for an antimigraine drug,
increase in heart rate of at least 20 bpm for a cardiac stimulant, or 10 mmHg fall in
diastolic blood pressure for an antihypertensive.
Data is obtained from a population. Unlike graded dose-response graphs,
data for quantal dose-response curves is obtained from many individuals.
ED50
The graph below shows how ED50 is calculated.