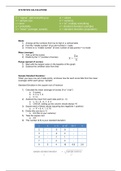
STATISTICS CALCULATIONS
Σ = “sigma”, add everything up xi = values
n = sample size s2 = variance
ε = error π = “pi”, multiply everything
p = probability s = standard deviation (sample)
x̄ = “mean” (average, sample) = “mean” (average, sample) σ = standard deviation (population)
Mode:
1) Arrange all the numbers from low to high in a vertical table
2) Find the “middle number” (if an odd number) = mode
3) If there is no “middle number” (if even number of data points) = no mode
Mean (average):
1) Add up all the scores
2) Divide by the “n” (number of scores)
Range (spread of scores):
1) Start with the largest value on the baseline of the graph
2) Subtract the smallest value from that
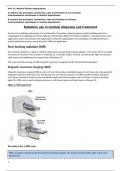
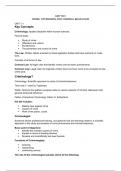
Sample Standard Deviation:
When you have one set of data points, sd shows how far each score falls from the mean
(average) within each group: “sample”
Standard Deviation is the square root of Variance
1) Calculate the mean (average) of scores (x̅ or “x bar”) or “x bar”)
a. 5 scores
b. 2, 3, 4, 7, 9
c. x̅ or “x bar”) = 5
2) Subtract the mean from each data point (x - x̅ or “x bar”))
a. x - x̅ or “x bar”) = -3, -2, -1, 2, 4
b. CHECK: adding up this column should always =0
3) Square each of these values (squaring two negatives = positive)
a. x - x̅ or “x bar”)2 = 9, 4, 1, 4, 16
4) Divide this sum by (n-1)
a. 6.8 (this is your variance)
5) Take the square root
a. 2.6
6) This number (2.6) is your standard deviation
x x̅ or “x bar”) x - x̅ or “x bar”) x - x̅2 x̅ or “x bar”)/n-1 σ
2 - -3 9 - -
3 - -2 4 - -
4 - -1 1 - -
7 - 2 4 - -
9 5 4 16 6.8 2.6
, -2 σ = -5.2 -1 σ = -2.6 1 σ = 2.6 2 σ = 5.2
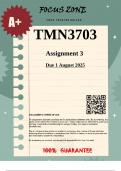
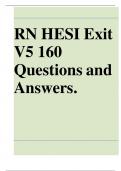
Sample Variance
The average of the squared differences from the mean.
Variance = Standard Deviation2
https://www.wikihow.com/Calculate-Variance
https://www.youtube.com/watch?v=qqOyy_NjflU
1) Calculate the mean (average) of scores (x̅ or “x bar”) or “x bar”)
2) Subtract the mean from each data point (x - x̅ or “x bar”))
a. CHECK: adding up this column should always =0
3) Square each of these values (two negatives2 = positive)
4) Add them all up (Σ)
5) Find your n-1 value (n = 5, n - 1 = 4)
6) Divide the sum by the (n-1)
7) The result of this is standard deviation.
8) Square this to get variance.
x x̅ or “x bar”) xi - x̅ x - x̅2 Σ Σ ÷ n-
1
2 5 -3 9 34 8.5
3 - -2 4 - -
4 - -1 1 - -
7 - 2 4 - -
9 - 4 16 - -
Deviance
1) Subtract a data point from the average (xi - x̅ or “x bar”))
a. Data point = 5, average = 6
b. Deviance = -1
Total deviance
1) Add up all deviances for every data point
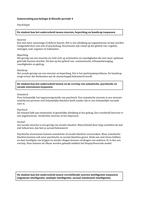
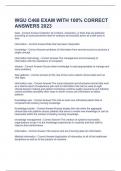
Interquartile range
Interquartile range: IQR = Q3 – Q1
1) Put the numbers in order: 1, 2, 5, 6, 7, 9, 12, 15, 18, 19, 27
2) Find the median: place parentheses around the numbers above and below the
median so Q1 and Q3 are easier to spot:(1, 2, 5, 6, 7), 9, (12, 15, 18, 19, 27)
3) Find Q1 (Lower Quartile) and Q3 (Upper Quartile)
Σ = “sigma”, add everything up xi = values
n = sample size s2 = variance
ε = error π = “pi”, multiply everything
p = probability s = standard deviation (sample)
x̄ = “mean” (average, sample) = “mean” (average, sample) σ = standard deviation (population)
Mode:
1) Arrange all the numbers from low to high in a vertical table
2) Find the “middle number” (if an odd number) = mode
3) If there is no “middle number” (if even number of data points) = no mode
Mean (average):
1) Add up all the scores
2) Divide by the “n” (number of scores)
Range (spread of scores):
1) Start with the largest value on the baseline of the graph
2) Subtract the smallest value from that
Sample Standard Deviation:
When you have one set of data points, sd shows how far each score falls from the mean
(average) within each group: “sample”
Standard Deviation is the square root of Variance
1) Calculate the mean (average) of scores (x̅ or “x bar”) or “x bar”)
a. 5 scores
b. 2, 3, 4, 7, 9
c. x̅ or “x bar”) = 5
2) Subtract the mean from each data point (x - x̅ or “x bar”))
a. x - x̅ or “x bar”) = -3, -2, -1, 2, 4
b. CHECK: adding up this column should always =0
3) Square each of these values (squaring two negatives = positive)
a. x - x̅ or “x bar”)2 = 9, 4, 1, 4, 16
4) Divide this sum by (n-1)
a. 6.8 (this is your variance)
5) Take the square root
a. 2.6
6) This number (2.6) is your standard deviation
x x̅ or “x bar”) x - x̅ or “x bar”) x - x̅2 x̅ or “x bar”)/n-1 σ
2 - -3 9 - -
3 - -2 4 - -
4 - -1 1 - -
7 - 2 4 - -
9 5 4 16 6.8 2.6
, -2 σ = -5.2 -1 σ = -2.6 1 σ = 2.6 2 σ = 5.2
Sample Variance
The average of the squared differences from the mean.
Variance = Standard Deviation2
https://www.wikihow.com/Calculate-Variance
https://www.youtube.com/watch?v=qqOyy_NjflU
1) Calculate the mean (average) of scores (x̅ or “x bar”) or “x bar”)
2) Subtract the mean from each data point (x - x̅ or “x bar”))
a. CHECK: adding up this column should always =0
3) Square each of these values (two negatives2 = positive)
4) Add them all up (Σ)
5) Find your n-1 value (n = 5, n - 1 = 4)
6) Divide the sum by the (n-1)
7) The result of this is standard deviation.
8) Square this to get variance.
x x̅ or “x bar”) xi - x̅ x - x̅2 Σ Σ ÷ n-
1
2 5 -3 9 34 8.5
3 - -2 4 - -
4 - -1 1 - -
7 - 2 4 - -
9 - 4 16 - -
Deviance
1) Subtract a data point from the average (xi - x̅ or “x bar”))
a. Data point = 5, average = 6
b. Deviance = -1
Total deviance
1) Add up all deviances for every data point
Interquartile range
Interquartile range: IQR = Q3 – Q1
1) Put the numbers in order: 1, 2, 5, 6, 7, 9, 12, 15, 18, 19, 27
2) Find the median: place parentheses around the numbers above and below the
median so Q1 and Q3 are easier to spot:(1, 2, 5, 6, 7), 9, (12, 15, 18, 19, 27)
3) Find Q1 (Lower Quartile) and Q3 (Upper Quartile)