Thermodynamics Summary
Eric Tüschenbönner
March 2019
1 List of constants
Symbol Value Unit
Unified atomic mass u 1.661 × 10⁻²⁷ kg
Avogadro’s constant NA 6.02 × 10²³ /mol
Gas constant R 8.31 J /K mol
Boltzmann’s constant k 1.38 × 10⁻²³ J /K
Stefan-Boltzmann constant σ 5.67 × 10⁻⁸ W/ m2 K 4
2 Chapter 17
2.1 Ideal gas law
P V = nRT = N kT (1)
2.2 Molar mass & Avogadro’s constant
m
n= (2)
M
Where the molecular mass M [g /mol] is given as the atomic mass number in the periodic table.
N
n= (3)
NA
2.3 Thermal equilibrium & the zeroth law of thermodynamics
Thermal equilibrium: two objects at different temperatures placed in contact will eventually
reach the same temperature.
Zeroth law: If two systems are in thermal equilibrium with a third system, then they are in
thermal equilibrium with each other.
2.4 Thermal expansion
Coefficient of linear expansion α and of volume expansion beta:
∆l = αl0 ∆T (4)
∆V = βV0 ∆T (5)
1
,3 Chapter 18
3.1 Ideal gas law and molecular interpretation of temperature
Assumptions of kinetic theory:
• Large number of molecules N, in random motion
• Average separation >> diameter
• No intermolecular forces
• Elastic collisions
The average kinetic energy per molecule is given by:
1 3
K= mv 2 = kT (6)
2 2
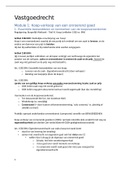
3.2 Distribution of molecular speeds
A distinction is made between different molecular speeds. The root-mean-square velocity vrms ,
the most probable velocity vp , and the average velocity v.
r
3kT
vrms = (7)
m
r
2kT
vp = (8)
m
r
8kT
v= (9)
πm
The Maxwell distribution of speeds is only temperature dependent:
Figure 1: The Maxwell distribution of speeds
2
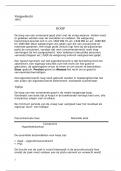
, 3.3 Real gases and change of phase
The PV diagram for a real substance shows that as the temperature approaches the critical
temperature at c, below which the gas changes to liquid at sufficient pressure, the behaviour of
the gas diverts from the real gas prediction.
Liquefaction occurs at point b - the volume decreases with no change in pressure. At point a, all of
the substance has become liquid.
In liquid state, there is a steep rise in pressure at a small volume change due to the fact that
liquids are nearly incompressible.
Figure 2: PV diagram of gas behaviour and phase change at critical temperature
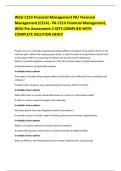
Phase transition is temperature and pressure dependent, as shown in the PT diagrams below.
On the different lines, 2 phases are in equilibrium or at their transition lines. At higher pressure
and/or temperature than the critical point, an element will transition to the supercritical phase
where liquid and gas cannot be distinguished.
Sublimation refers to the process whereby a solid directly changes into vapour.
Only at the triple point (Ttp , Ptp ) all three phases can coexist in equilibrium.
Figure 3: Phase diagram for water
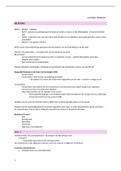
Figure 4: Carbon dioxide
3
Eric Tüschenbönner
March 2019
1 List of constants
Symbol Value Unit
Unified atomic mass u 1.661 × 10⁻²⁷ kg
Avogadro’s constant NA 6.02 × 10²³ /mol
Gas constant R 8.31 J /K mol
Boltzmann’s constant k 1.38 × 10⁻²³ J /K
Stefan-Boltzmann constant σ 5.67 × 10⁻⁸ W/ m2 K 4
2 Chapter 17
2.1 Ideal gas law
P V = nRT = N kT (1)
2.2 Molar mass & Avogadro’s constant
m
n= (2)
M
Where the molecular mass M [g /mol] is given as the atomic mass number in the periodic table.
N
n= (3)
NA
2.3 Thermal equilibrium & the zeroth law of thermodynamics
Thermal equilibrium: two objects at different temperatures placed in contact will eventually
reach the same temperature.
Zeroth law: If two systems are in thermal equilibrium with a third system, then they are in
thermal equilibrium with each other.
2.4 Thermal expansion
Coefficient of linear expansion α and of volume expansion beta:
∆l = αl0 ∆T (4)
∆V = βV0 ∆T (5)
1
,3 Chapter 18
3.1 Ideal gas law and molecular interpretation of temperature
Assumptions of kinetic theory:
• Large number of molecules N, in random motion
• Average separation >> diameter
• No intermolecular forces
• Elastic collisions
The average kinetic energy per molecule is given by:
1 3
K= mv 2 = kT (6)
2 2
3.2 Distribution of molecular speeds
A distinction is made between different molecular speeds. The root-mean-square velocity vrms ,
the most probable velocity vp , and the average velocity v.
r
3kT
vrms = (7)
m
r
2kT
vp = (8)
m
r
8kT
v= (9)
πm
The Maxwell distribution of speeds is only temperature dependent:
Figure 1: The Maxwell distribution of speeds
2
, 3.3 Real gases and change of phase
The PV diagram for a real substance shows that as the temperature approaches the critical
temperature at c, below which the gas changes to liquid at sufficient pressure, the behaviour of
the gas diverts from the real gas prediction.
Liquefaction occurs at point b - the volume decreases with no change in pressure. At point a, all of
the substance has become liquid.
In liquid state, there is a steep rise in pressure at a small volume change due to the fact that
liquids are nearly incompressible.
Figure 2: PV diagram of gas behaviour and phase change at critical temperature
Phase transition is temperature and pressure dependent, as shown in the PT diagrams below.
On the different lines, 2 phases are in equilibrium or at their transition lines. At higher pressure
and/or temperature than the critical point, an element will transition to the supercritical phase
where liquid and gas cannot be distinguished.
Sublimation refers to the process whereby a solid directly changes into vapour.
Only at the triple point (Ttp , Ptp ) all three phases can coexist in equilibrium.
Figure 3: Phase diagram for water
Figure 4: Carbon dioxide
3