Unité scolaire | Academic Unit
Faculté des sciences sociales | Faculty of Social Sciences
Model A, part 1
Exercise 1 (40%): Table 1 offers information about the quantity of a good that is supplied and demanded at
various prices in a market with perfect competition. Answer the following questions using the information in
table 1.
Table 1
Price Quantity Demanded Quantity Supplied
2 100 0
4 80 30
6 60 60
8 40 90
10 20 120
12 0 150
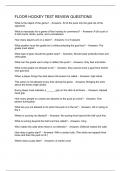
a. Initially the market is in equilibrium; Plot the demand and supply curves on a graph, with price on the y-axis
and quantity on the x –axis. Calculate the Consumer Surplus. Show your calculations.
Consumer surplus = (60* (12-6) )/2 = 180
13
12
11
10
9
8
7
Demand
6
Supply
5
4
3
2
1
0
0 10 20 30 40 50 60 70 80 90 100 110 120 130 140 150 160
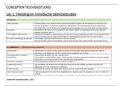
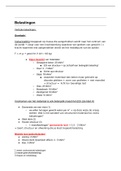
, b. Suppose that the government imposes a $2 per unit tax on sellers of this good. Draw on the graph the
changes that this market experiences because of the tax. Show in the graph the new producer surplus, the
tax revenue and the deadweight loss.
Purple: dead weight loss.
Green: producer surplus
Red: tax revenue
15
14
13
12
11
10
9
8
7
6
5
4
3
2
1
0
0 10 20 30 40 50 60 70 80 90 100 110 120 130 140 150 160
Demand Supply Supply 2
c. Explain briefly the relationship between tax incidence and the price elasticity of supply and demand.
Whichever side of the market is more price elastic will shoulder less of the burden. If they are equal elastic they
hold the same burden.
Exercise 2 (30%): The following table (Table 2) shows Marc’s preferences. Basically, he only cares about eating
pizza and going to the movies.
Table 2
Total Utility from Number of Total Utility from
Number of pizzas Marginal Utility
consumption of movie tickets buying movie
(Total Units) of pizzas
pizzas (Total Units) tickets
0 0 0 0 -
1 20 1 30 20-0= 20
2 40 2 60 40-20= 20
3 58 3 ? 58-40= 18
4 73 4 98 73-58=15
5 85 5 113 85-73=12
Faculté des sciences sociales | Faculty of Social Sciences
Model A, part 1
Exercise 1 (40%): Table 1 offers information about the quantity of a good that is supplied and demanded at
various prices in a market with perfect competition. Answer the following questions using the information in
table 1.
Table 1
Price Quantity Demanded Quantity Supplied
2 100 0
4 80 30
6 60 60
8 40 90
10 20 120
12 0 150
a. Initially the market is in equilibrium; Plot the demand and supply curves on a graph, with price on the y-axis
and quantity on the x –axis. Calculate the Consumer Surplus. Show your calculations.
Consumer surplus = (60* (12-6) )/2 = 180
13
12
11
10
9
8
7
Demand
6
Supply
5
4
3
2
1
0
0 10 20 30 40 50 60 70 80 90 100 110 120 130 140 150 160
, b. Suppose that the government imposes a $2 per unit tax on sellers of this good. Draw on the graph the
changes that this market experiences because of the tax. Show in the graph the new producer surplus, the
tax revenue and the deadweight loss.
Purple: dead weight loss.
Green: producer surplus
Red: tax revenue
15
14
13
12
11
10
9
8
7
6
5
4
3
2
1
0
0 10 20 30 40 50 60 70 80 90 100 110 120 130 140 150 160
Demand Supply Supply 2
c. Explain briefly the relationship between tax incidence and the price elasticity of supply and demand.
Whichever side of the market is more price elastic will shoulder less of the burden. If they are equal elastic they
hold the same burden.
Exercise 2 (30%): The following table (Table 2) shows Marc’s preferences. Basically, he only cares about eating
pizza and going to the movies.
Table 2
Total Utility from Number of Total Utility from
Number of pizzas Marginal Utility
consumption of movie tickets buying movie
(Total Units) of pizzas
pizzas (Total Units) tickets
0 0 0 0 -
1 20 1 30 20-0= 20
2 40 2 60 40-20= 20
3 58 3 ? 58-40= 18
4 73 4 98 73-58=15
5 85 5 113 85-73=12