5.2 Basic probability theory
REVIEW: DESCRIPTIVE VS. INFERENTIAL
Core feature: statistics is exceedingly useful in managing and understanding variation
- Variation: different results when we repeat measurements
Role in hypothesis testing: Statistics provides tools to determine what a hypothesis should leads us
to expect even given variation
Role in generating knowledge: Kind of inductive inference, so helps extend from what we know to
make predictions/generalizations
Descriptive Statistics: use of statistics in summarizing, describing, and displaying data in a
meaningful way
- ‘Mean score was 7.5’= Descriptive; it is just telling you the mean
Inferential Statistics: using statistical reasoning to draw broader conclusions from limited data, such
as generalizations and projections
- Like a kind of inductive inference: either inferring properties of population based on sample
data or properties of a sample based on information about population
- ‘Dutch adults are nearly 12kg heavier now than they were in 1960’= inference, it is taking
two datasets and makes an inference
Probability Theory: a mathematical theory developed to deal with outcomes that are individually
unpredictable but that behave in predictable ways over multiple occurrences
In context of statistically reasoning, it allows us
- To quantify the degree of predictability, randomness, or uncertainty of an outcome, and
- Calculate that a certain outcome occurs, given that another outcome occurs
BASIC PROBABILITY THEORY
Random variables: have values that are individually unpredictable, but predictable in the aggregate
Outcome/sample space: set of all values a random variable can have
- Set: an abstract grouping of things, ‘{’ and ‘}’ indicate a set
- For a coin toss the outcome space is: heads or tails. We will refer to the values of a random
variable with small letters, in this case, say, h and t. → X = {h; t}
- D4: X = {D=1, D=2, D=3, D=4}, there are four possible values when you throw this dice
D6: X = {D=1, D=2, D=3, D=4, D=5, D=6}
D8: X = {D=1, D=2, D=3, D=4, D=5, D=6, D=7, D=8}
D10: X = {D=1, D=2, D=3, D=4, D=5, D=6, D=7, D=8, D=9, D=10}
… etc.
Probabilistic reasoning begins with the observation of how probable (likely) it is for a random
variable to take any given value
- Maximally improbable: 0
- Maximally probable: 1
▪ Pr(D=1 or D=2 or D=3 or D=4) = 1 (in case of the D4)
▪ Coin-toss example, there’s a 100% chance that the coin lands on either heads or tails
(since this is the whole outcome space) → Pr(X =h or t) = 1
Totally probability of an outcome space is always 1.
The outcomes in any outcome space have two important properties:
- Mutually exclusive: no more than one of the outcomes can occur at any given time
▪ On a single coin toss, you might get heads or tails, but you will never get both
- Collectively exhaustive: at least one of the outcomes must occur at any given time
▪ For a successful coin toss, the coin must land heads up or tails up—there is no third
option
1
,If die is fair, then each outcome is just as probable: Pr(D=1) = Pr(D=2) = Pr(D=3) = Pr(D=4) = ¼
For a fair coin, Pr(X = h) = Pr(X = t)= = ½, or .5, or 50%
- For any random variable with equally probable outcomes, the probability of one of those
outcomes is one divided by the number of possible outcomes
Random variable that is not fair is biased: One or more outcomes is more likely than others. This is
the case when the die would we more weighted on one side.
- French roulette: numbers 0-36 all occur once, all outcomes are equally likely= 1/37
- American: two zero’s, so it’s biased towards zero
▪ Probability of any number from one to 36 is 1⁄38
▪ Probability of getting zero is 2⁄38, or 1⁄19
Independent outcomes: probability of each outcome is not influenced by past outcomes. If
outcomes are not independent, then outcomes are not fair
Lots of random variables are unfair. For example:
LeBron James’s free throw success is a random variable. Let’s call this variable Y. There are
only two possible outcomes: LeBron either misses the free throw or scores.
Outcome space of Y = {miss; score}. The problem is that the chance of LeBron scoring versus
missing is probably not 50⁄50. There is a bias in favor of the outcome of scoring; for LeBron
James, this is more likely than missing. The outcomes might also fail to be independent:
missing a shot might make LeBron more, or less, likely to score on the next free throw.
The larger the probability, the more likely an event is to occur; The smaller the probability, the less
likely an event is to occur
- Pr(a) = 0 means a is guaranteed not to happen
▪ The probability that you roll a seven on a single, regular die is 0
- Pr(a) = 1 means a is guaranteed to happen
▪ The probability that you roll some number between one and six is 1
- Pr(a) = .65 means a is more likely to happen than not to happen
- Pr(a) = .35 means a is unlikely (though it still might occur)
Addition Rule: the probability that any series of outcomes will occur is the sum of their individual
probabilities. Beware! Adding probabilities in this way only works for mutually exclusive outcomes.
What is the probably of rolling an even number on a D6?
Pr(D=2 or D=4 or D=6)= Pr(D=2) + Pr(D=4) + Pr(D=6) → 1/6 + 1/6 + 1/6 = ½
What is the probability of rolling an even or a six?
Pr(D=2) + Pr(D=4) + Pr(D=6) + Pr(D=6)
Because six is one of the even numbers on the die, the outcomes of rolling a six and rolling an
even number are not mutually exclusive. The six is already included so we don’t add it a
second time: Pr(D=2) + Pr(D=4) + Pr(D=6)
Multiplication Rule: probability that all of a series of outcomes occurs is the result of multiplying
their individual probabilities. Beware! They must satisfy the independence condition
Probability of rolling two sixes when you roll two dice? Put another way, this question is
asking for the probability of rolling a six on one die and also rolling a six on a second die.
Pr(D1= 6) x Pr(D2 =6) → 1/6 x 1/6 = 1/36
Subtraction Rule: you can calculate the probability of some outcome by subtracting the probability
of all other outcomes in the outcome space from 1. Works only for collectively exhaustive outcomes
Probability of rolling anything that is not 5?
Pr(D=not-5) = 1 – Pr(D=5) → Pr(D=not-5) = 1 – 1/6 → Pr(D=not-5) = 5/6
2
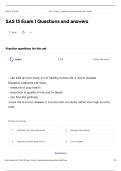
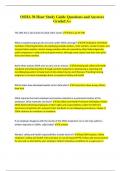
, Rule Language Function Condition Result
Addition Any Disjunction (not) Mutually exclusive Prob. always increases
Multiplication All Conjunction (and) Independent Prob. always decreases
Subtraction Not Negation (not) Collectively exhaustive Prob. can be large or small
Conditional Probability: the probability of an occurrence given that some other event has occurred.
We can write the conditional probability of a random variable Y taking the value y, given that a
variable X takes the value x as Pr(Y =y | X =x). The symbol ‘|’ can be read as given that.
For two independent events, the conditional probability of one event given the other is the same as
the original’s probability
- Probability of rolling a 6 with this die given that we rolled a 5 with that die = probability of
rolling a 6 with this die
Random variables X and Y are statistically independent when:
Pr(X=x|Y=y) = Pr(Y=y) and Pr(Y=y|X=x) = Pr(X=x)
If y is not statistically independent from x, then probability of y occurring goes up/down if x occurs
- Pr(D1= 2 or 4 or 6 | D1= 4) = 1
- Pr(D1= 2 or 4 or 6 | D1= 5) = 0
For x and y, the values of two random variables, the probability of y occurring given that the other
event x occurs can be calculated using the following conditional probability formula:
Pr(Y =y & X =x)
Pr(Y =y| X =x) = Pr(X =x)
This calculation only works when the probability of x is greater than 0.
Probably of rolling two sixes, given that one is a six? Pr(D1= 6 and D2=6 | D2=6)?
𝑃𝑟(𝐷2=6 𝑎𝑛𝑑 𝐷1=6) 1/36
Pr(D1=6 & D2=6| D1=6) = 𝑃𝑟(𝐷1=6)
= 1/6
= 1/6
What is the probability that you roll a number less than four, given that you roll an odd?
𝑃𝑟((𝐷= 1 𝑜𝑟 2 𝑜𝑟 3) & (𝐷= 1 𝑜𝑟 3 𝑜𝑟 5)) 1/6
Pr(D= 1 or 2 or 3| D= 1 or 3 or 5)= 𝑃𝑟(𝐷=1 𝑜𝑟 3 𝑜𝑟 5)
= 1/2 = 2/3
Notice that the probability of rolling a one, two, or three and rolling a one, three, or five
is the same as the probability of rolling a one or three. Why? Because those are the only
two ways of rolling both an odd number and a number less than four
‘Since this is a fair roulette wheel, black and red come up equally often. There has been a streak of
black. Therefore, red will come up very soon’ is called gambler’s fallacy. Those seduced by the
gambler’s fallacy believe that the conditional probability of some later outcome (in this case, landing
on red) increases given that there recently has been a statistically unusual streak of a different
outcome (in this case, landing on black). In fact, each spin of the fair roulette is statistically
independent; there is no way for the outcome of one spin to influence the outcome of the next spin
3
, 5.3 Descriptive Statistics
Variable: anything that can vary, change or occur in different states and that can be measured
Value: what the variable is measured to be
Quantitative variable: values that are numbers, amounts, or magnitudes
- Can be expressed by numbers or ‘scores’
- Can be discrete or continuous
o Discrete: can be counted e.g. goals scored (you can’t score half a goal)
o Continuous: you can take any value in a particular range
Qualitative variables: values that cannot be captured numerically, they must be described with
labels and categories e.g. Blood type, favorite color
Collecting data is the process of eliciting information from the target phenomenon then recording
the values of variables. The roper method of data collection depends upon type of variable… Notice
that it’s possible to get quantitative data about all variables, even qualitative variables;
- Qualitative variable: Blood type, quantitative observation= 38% of people are O-positive
Quantitative data about how often a variable takes on different values enable it to be treated as a
random variable. This means we can use probability theory to reason about it
- While individual valuations might be unpredictable, they can be predicable in aggregate
- It’s a matter of chance to see what value a variable has at a given moment, but it’s possible
to predict what values it is likely to have over time
Descriptive statistics is all about describing the patterns in the values that variables take on
Descriptive statistics involves summarizing, describing, and displaying data in a meaningful way
- Central Question: How should data sets be described?
- Answer: Simple, clear, and appropriate presentation of data
o Numbers & Visual Representations (Charts, tables, and graphs)
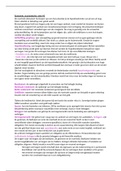
Visual representations
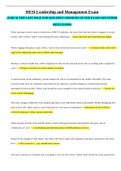
Pie Charts: circles divided into different-sized slices, like a pie, to show how much
of the outcome space falls into different categories
- Area inside each slice represents the percentage associated with some
value of the variable
- The categories in a pie chart should be mutually exclusive and collectively
exhaustive so the pie slices don’t overlap and so they add up to a whole pie
- Most effective when representing a variable that can take a small number
of distinct values
- Next to useless when lots of small slices/distinct values variable can take
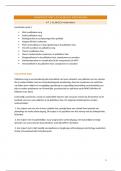
Bar charts use bars of different heights to show amounts for different values of some variable
- Values are typically placed horizontally and equally spaced;
vertical bars are used to represent the size of each value
- Size can correspond to absolute number or percentage
o Like the number of students who got an A, B, C, D, or F
on the most recent test, or a percentage, like the
percentage of the class who got each grade
- Like pie charts, bar charts are great for categorical variables that
can take discrete values. The values should still be mutually
exclusive, but they don’t need to be collectively exhaustive.
4
REVIEW: DESCRIPTIVE VS. INFERENTIAL
Core feature: statistics is exceedingly useful in managing and understanding variation
- Variation: different results when we repeat measurements
Role in hypothesis testing: Statistics provides tools to determine what a hypothesis should leads us
to expect even given variation
Role in generating knowledge: Kind of inductive inference, so helps extend from what we know to
make predictions/generalizations
Descriptive Statistics: use of statistics in summarizing, describing, and displaying data in a
meaningful way
- ‘Mean score was 7.5’= Descriptive; it is just telling you the mean
Inferential Statistics: using statistical reasoning to draw broader conclusions from limited data, such
as generalizations and projections
- Like a kind of inductive inference: either inferring properties of population based on sample
data or properties of a sample based on information about population
- ‘Dutch adults are nearly 12kg heavier now than they were in 1960’= inference, it is taking
two datasets and makes an inference
Probability Theory: a mathematical theory developed to deal with outcomes that are individually
unpredictable but that behave in predictable ways over multiple occurrences
In context of statistically reasoning, it allows us
- To quantify the degree of predictability, randomness, or uncertainty of an outcome, and
- Calculate that a certain outcome occurs, given that another outcome occurs
BASIC PROBABILITY THEORY
Random variables: have values that are individually unpredictable, but predictable in the aggregate
Outcome/sample space: set of all values a random variable can have
- Set: an abstract grouping of things, ‘{’ and ‘}’ indicate a set
- For a coin toss the outcome space is: heads or tails. We will refer to the values of a random
variable with small letters, in this case, say, h and t. → X = {h; t}
- D4: X = {D=1, D=2, D=3, D=4}, there are four possible values when you throw this dice
D6: X = {D=1, D=2, D=3, D=4, D=5, D=6}
D8: X = {D=1, D=2, D=3, D=4, D=5, D=6, D=7, D=8}
D10: X = {D=1, D=2, D=3, D=4, D=5, D=6, D=7, D=8, D=9, D=10}
… etc.
Probabilistic reasoning begins with the observation of how probable (likely) it is for a random
variable to take any given value
- Maximally improbable: 0
- Maximally probable: 1
▪ Pr(D=1 or D=2 or D=3 or D=4) = 1 (in case of the D4)
▪ Coin-toss example, there’s a 100% chance that the coin lands on either heads or tails
(since this is the whole outcome space) → Pr(X =h or t) = 1
Totally probability of an outcome space is always 1.
The outcomes in any outcome space have two important properties:
- Mutually exclusive: no more than one of the outcomes can occur at any given time
▪ On a single coin toss, you might get heads or tails, but you will never get both
- Collectively exhaustive: at least one of the outcomes must occur at any given time
▪ For a successful coin toss, the coin must land heads up or tails up—there is no third
option
1
,If die is fair, then each outcome is just as probable: Pr(D=1) = Pr(D=2) = Pr(D=3) = Pr(D=4) = ¼
For a fair coin, Pr(X = h) = Pr(X = t)= = ½, or .5, or 50%
- For any random variable with equally probable outcomes, the probability of one of those
outcomes is one divided by the number of possible outcomes
Random variable that is not fair is biased: One or more outcomes is more likely than others. This is
the case when the die would we more weighted on one side.
- French roulette: numbers 0-36 all occur once, all outcomes are equally likely= 1/37
- American: two zero’s, so it’s biased towards zero
▪ Probability of any number from one to 36 is 1⁄38
▪ Probability of getting zero is 2⁄38, or 1⁄19
Independent outcomes: probability of each outcome is not influenced by past outcomes. If
outcomes are not independent, then outcomes are not fair
Lots of random variables are unfair. For example:
LeBron James’s free throw success is a random variable. Let’s call this variable Y. There are
only two possible outcomes: LeBron either misses the free throw or scores.
Outcome space of Y = {miss; score}. The problem is that the chance of LeBron scoring versus
missing is probably not 50⁄50. There is a bias in favor of the outcome of scoring; for LeBron
James, this is more likely than missing. The outcomes might also fail to be independent:
missing a shot might make LeBron more, or less, likely to score on the next free throw.
The larger the probability, the more likely an event is to occur; The smaller the probability, the less
likely an event is to occur
- Pr(a) = 0 means a is guaranteed not to happen
▪ The probability that you roll a seven on a single, regular die is 0
- Pr(a) = 1 means a is guaranteed to happen
▪ The probability that you roll some number between one and six is 1
- Pr(a) = .65 means a is more likely to happen than not to happen
- Pr(a) = .35 means a is unlikely (though it still might occur)
Addition Rule: the probability that any series of outcomes will occur is the sum of their individual
probabilities. Beware! Adding probabilities in this way only works for mutually exclusive outcomes.
What is the probably of rolling an even number on a D6?
Pr(D=2 or D=4 or D=6)= Pr(D=2) + Pr(D=4) + Pr(D=6) → 1/6 + 1/6 + 1/6 = ½
What is the probability of rolling an even or a six?
Pr(D=2) + Pr(D=4) + Pr(D=6) + Pr(D=6)
Because six is one of the even numbers on the die, the outcomes of rolling a six and rolling an
even number are not mutually exclusive. The six is already included so we don’t add it a
second time: Pr(D=2) + Pr(D=4) + Pr(D=6)
Multiplication Rule: probability that all of a series of outcomes occurs is the result of multiplying
their individual probabilities. Beware! They must satisfy the independence condition
Probability of rolling two sixes when you roll two dice? Put another way, this question is
asking for the probability of rolling a six on one die and also rolling a six on a second die.
Pr(D1= 6) x Pr(D2 =6) → 1/6 x 1/6 = 1/36
Subtraction Rule: you can calculate the probability of some outcome by subtracting the probability
of all other outcomes in the outcome space from 1. Works only for collectively exhaustive outcomes
Probability of rolling anything that is not 5?
Pr(D=not-5) = 1 – Pr(D=5) → Pr(D=not-5) = 1 – 1/6 → Pr(D=not-5) = 5/6
2
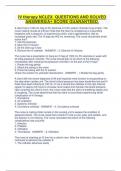
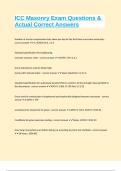
, Rule Language Function Condition Result
Addition Any Disjunction (not) Mutually exclusive Prob. always increases
Multiplication All Conjunction (and) Independent Prob. always decreases
Subtraction Not Negation (not) Collectively exhaustive Prob. can be large or small
Conditional Probability: the probability of an occurrence given that some other event has occurred.
We can write the conditional probability of a random variable Y taking the value y, given that a
variable X takes the value x as Pr(Y =y | X =x). The symbol ‘|’ can be read as given that.
For two independent events, the conditional probability of one event given the other is the same as
the original’s probability
- Probability of rolling a 6 with this die given that we rolled a 5 with that die = probability of
rolling a 6 with this die
Random variables X and Y are statistically independent when:
Pr(X=x|Y=y) = Pr(Y=y) and Pr(Y=y|X=x) = Pr(X=x)
If y is not statistically independent from x, then probability of y occurring goes up/down if x occurs
- Pr(D1= 2 or 4 or 6 | D1= 4) = 1
- Pr(D1= 2 or 4 or 6 | D1= 5) = 0
For x and y, the values of two random variables, the probability of y occurring given that the other
event x occurs can be calculated using the following conditional probability formula:
Pr(Y =y & X =x)
Pr(Y =y| X =x) = Pr(X =x)
This calculation only works when the probability of x is greater than 0.
Probably of rolling two sixes, given that one is a six? Pr(D1= 6 and D2=6 | D2=6)?
𝑃𝑟(𝐷2=6 𝑎𝑛𝑑 𝐷1=6) 1/36
Pr(D1=6 & D2=6| D1=6) = 𝑃𝑟(𝐷1=6)
= 1/6
= 1/6
What is the probability that you roll a number less than four, given that you roll an odd?
𝑃𝑟((𝐷= 1 𝑜𝑟 2 𝑜𝑟 3) & (𝐷= 1 𝑜𝑟 3 𝑜𝑟 5)) 1/6
Pr(D= 1 or 2 or 3| D= 1 or 3 or 5)= 𝑃𝑟(𝐷=1 𝑜𝑟 3 𝑜𝑟 5)
= 1/2 = 2/3
Notice that the probability of rolling a one, two, or three and rolling a one, three, or five
is the same as the probability of rolling a one or three. Why? Because those are the only
two ways of rolling both an odd number and a number less than four
‘Since this is a fair roulette wheel, black and red come up equally often. There has been a streak of
black. Therefore, red will come up very soon’ is called gambler’s fallacy. Those seduced by the
gambler’s fallacy believe that the conditional probability of some later outcome (in this case, landing
on red) increases given that there recently has been a statistically unusual streak of a different
outcome (in this case, landing on black). In fact, each spin of the fair roulette is statistically
independent; there is no way for the outcome of one spin to influence the outcome of the next spin
3
, 5.3 Descriptive Statistics
Variable: anything that can vary, change or occur in different states and that can be measured
Value: what the variable is measured to be
Quantitative variable: values that are numbers, amounts, or magnitudes
- Can be expressed by numbers or ‘scores’
- Can be discrete or continuous
o Discrete: can be counted e.g. goals scored (you can’t score half a goal)
o Continuous: you can take any value in a particular range
Qualitative variables: values that cannot be captured numerically, they must be described with
labels and categories e.g. Blood type, favorite color
Collecting data is the process of eliciting information from the target phenomenon then recording
the values of variables. The roper method of data collection depends upon type of variable… Notice
that it’s possible to get quantitative data about all variables, even qualitative variables;
- Qualitative variable: Blood type, quantitative observation= 38% of people are O-positive
Quantitative data about how often a variable takes on different values enable it to be treated as a
random variable. This means we can use probability theory to reason about it
- While individual valuations might be unpredictable, they can be predicable in aggregate
- It’s a matter of chance to see what value a variable has at a given moment, but it’s possible
to predict what values it is likely to have over time
Descriptive statistics is all about describing the patterns in the values that variables take on
Descriptive statistics involves summarizing, describing, and displaying data in a meaningful way
- Central Question: How should data sets be described?
- Answer: Simple, clear, and appropriate presentation of data
o Numbers & Visual Representations (Charts, tables, and graphs)
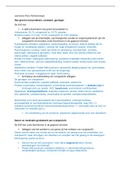
Visual representations
Pie Charts: circles divided into different-sized slices, like a pie, to show how much
of the outcome space falls into different categories
- Area inside each slice represents the percentage associated with some
value of the variable
- The categories in a pie chart should be mutually exclusive and collectively
exhaustive so the pie slices don’t overlap and so they add up to a whole pie
- Most effective when representing a variable that can take a small number
of distinct values
- Next to useless when lots of small slices/distinct values variable can take
Bar charts use bars of different heights to show amounts for different values of some variable
- Values are typically placed horizontally and equally spaced;
vertical bars are used to represent the size of each value
- Size can correspond to absolute number or percentage
o Like the number of students who got an A, B, C, D, or F
on the most recent test, or a percentage, like the
percentage of the class who got each grade
- Like pie charts, bar charts are great for categorical variables that
can take discrete values. The values should still be mutually
exclusive, but they don’t need to be collectively exhaustive.
4