Statistics and Data-Analysis
College 1
Types of statistics:
1. Descriptive statistics
Collection, organization, summarization/description and presentation of data. No conclusions
2. Inferential statistics
Generalizing from samples to populations, performing hypothesis testings, determining the
relationships between variables, making predictions. Conclusions are drawn from the sample
data
Prognoses toekomst geen meting dus inferential
Variables = any measured characteristic or attribute that differs for different subjects (height, eye
color, porosity of a rock)
Types of data:
1. Nominal
No order or ranking (rock type, hair color)
2. Ordinal
Ranking but no exact difference between ranks (mental condition)
3. Interval scale
Precise difference between ranks, but no ‘meaningful zero’ (temperature Celsius scale)
4. Ratio scale
Precise difference between ranks and a ‘meaningful zero’ (height, mass, velocity)
5. Counting scale (ratio discrete)
Measurements concern counts (number of earthquakes, wildfires in a given year)
6. Angular scale
Measurements have a directional component (flow direction, wind direction, flute casts)
Path for research:
Research question research design hypothesis collect info (sample) test conclusion
Collecting info:
- Random sample (SRS) very common
- Systematic sampling for example every two cm
- Stratified sampling separate groups
- Cluster sampling for example couple of hospitals representative for all
,Measures of central tendency (for data on interval, ratio, angular, counting scales)
- Mean or arithmetic average: expected value (gemiddelde)
- Median: midpoint of a low to high sorted data array
- Mode: value that occurs most in the data array
Statistic (applies to sample)
- Statistic is a characteristic/measure obtained by using values from sample
Parameter (applies to population)
- A numerical quantity reflecting a characteristic aspect of a population
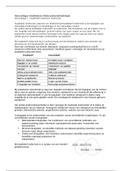
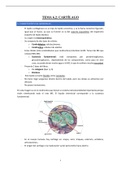
-
In dit voorbeeld d = distance, x = speed
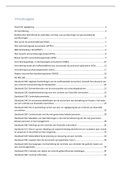
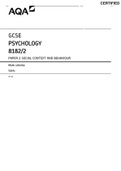
, A frequency distribution or histogram
- One of the first steps
- Number of observations falling into each class (Klassen = bins)
To make a histogram (in syllabus):
- Number of classes important, square root of the number of observations for number of
classes
- Class limits
- Class boundaries
- Class width
- Class midpoints
College 1
Types of statistics:
1. Descriptive statistics
Collection, organization, summarization/description and presentation of data. No conclusions
2. Inferential statistics
Generalizing from samples to populations, performing hypothesis testings, determining the
relationships between variables, making predictions. Conclusions are drawn from the sample
data
Prognoses toekomst geen meting dus inferential
Variables = any measured characteristic or attribute that differs for different subjects (height, eye
color, porosity of a rock)
Types of data:
1. Nominal
No order or ranking (rock type, hair color)
2. Ordinal
Ranking but no exact difference between ranks (mental condition)
3. Interval scale
Precise difference between ranks, but no ‘meaningful zero’ (temperature Celsius scale)
4. Ratio scale
Precise difference between ranks and a ‘meaningful zero’ (height, mass, velocity)
5. Counting scale (ratio discrete)
Measurements concern counts (number of earthquakes, wildfires in a given year)
6. Angular scale
Measurements have a directional component (flow direction, wind direction, flute casts)
Path for research:
Research question research design hypothesis collect info (sample) test conclusion
Collecting info:
- Random sample (SRS) very common
- Systematic sampling for example every two cm
- Stratified sampling separate groups
- Cluster sampling for example couple of hospitals representative for all
,Measures of central tendency (for data on interval, ratio, angular, counting scales)
- Mean or arithmetic average: expected value (gemiddelde)
- Median: midpoint of a low to high sorted data array
- Mode: value that occurs most in the data array
Statistic (applies to sample)
- Statistic is a characteristic/measure obtained by using values from sample
Parameter (applies to population)
- A numerical quantity reflecting a characteristic aspect of a population
-
In dit voorbeeld d = distance, x = speed
, A frequency distribution or histogram
- One of the first steps
- Number of observations falling into each class (Klassen = bins)
To make a histogram (in syllabus):
- Number of classes important, square root of the number of observations for number of
classes
- Class limits
- Class boundaries
- Class width
- Class midpoints