Statistics
Summary of stati sti cs 1
,Inhoud
Table of Contents
H1. Basics of statistics.............................................................................................................................3
H1.1. Graphs.......................................................................................................................................4
H2. Descriptive statistics.........................................................................................................................6
H2.1. Frequency distribution..............................................................................................................6
H2.2. Center and Spread.....................................................................................................................7
H2.3. Covariance and Correlation.......................................................................................................8
H2.4. combinatorics..........................................................................................................................10
H3. Probability......................................................................................................................................11
H3.1 rules of probability...................................................................................................................12
H3.2. probability tree and table........................................................................................................13
H3.3. Discrete and Continuous probability distribution....................................................................13
H3.4. (hyper)geometric probability distribution...............................................................................14
H3.5. Bernoulli probability distribution............................................................................................15
H3.6. binomial probability distribution.............................................................................................15
H3.7. poisson probability distribution...............................................................................................16
H3.8. normal probability distribution...............................................................................................16
H3.9. uniform distribution................................................................................................................17
H3.10. Student T-distribution............................................................................................................17
H3.11. Approximations.....................................................................................................................18
H3.12. use of probability tables........................................................................................................19
H4. Inferential statistics........................................................................................................................20
H4.1. central limit theorem and basics of inferential statistics.........................................................20
H4.2. central limit theorem and approximation by the normal distribution.....................................21
H4.3. population proportion.............................................................................................................22
H4.4. hypothesis testing...................................................................................................................23
H4.4.1. Steps of Hypothesis testing..............................................................................................23
H4.4.2. right-sided hypothesis test...............................................................................................24
H4.4.3. left-sided hypothesis test..................................................................................................25
H4.4.4. two-sided hypothesis test................................................................................................26
H4.4.5. Hypothesis testing proportions........................................................................................27
H4.4.6. Hypothesis testing by approximation by binomial............................................................28
H4.5. T-distribution and hypothesis testing......................................................................................29
Cheat Sheet..........................................................................................................................................30
Definitions............................................................................................................................................32
,H1. Basics of statistics
Statistics is the study of the collection, analysis, interpretation, presentation, and organization of data. In other
words, it is a mathematical discipline to collect, summarize data.
Branches of statistics:
descriptive statistics: set of methods used to summarize and describe main features of a set.
examples: mean, median, mode, percentile, frequency, variance, range, etc.
probability: a branch of mathematics that deals with the occurrence of a random event
examples: normal distribution, poission distribution, binomial distribution, probability, etc.
inferential statistics: use of measurements of sample groups to make generalizations about the
population.
examples: hypothesis testing, regressions analysis, etc.
To collect, measure and interpretate data, a choice has to be made: measure the whole population or a part of
it.
Population: group of all items that are interested to a statistic practitioner.
Parameter: characteristic that represent a population.
Sample: set of data drawn from the studied population / part of population.
Statistic: characteristics that represent a sample
To conduct an experiment, most practitioners use a (random) sample of the population, to measure, observe
and conclude something about the population. That is why most formula’s in this document conclude both the
formula for a sample experiment and the formula for a population experiment.
Data of an experiment can either be quantitative data or qualitative data.
quantitative data: data where measures of values or counts and are expressed as numbers.
qualitative data: data that cannot be counted, measured or easily expressed using numbers.
Quantitative data Qualitative data
Numerical date Descriptive data
Can be discrete or continuous (interval) Can be ordinal or nominal
Use of number: 1, 300, 8345, etc. Involves 5 senses: taste, feel see, hear and smell
Use of words: red, loud, grey, etc.
Discrete data: a count that involves integers — only a limited number of values is possible.
Example: 3 cats, 4 sisters, etc.
Continuous data: data that can take any value.
Example: 1.63 cm, 78,6 kg, 23,3 degrees, etc.
,Nominal data (scale): data that can be labelled or classified into mutually exclusive categories within a variable.
The order of data doesn’t matter.
Example: 5 red cars, preferred movie, 3 loud bangs
Ordinal data (scale): categorical, statistical data type where the variables have natural, ordered categories.
Example: 1st, 2nd, 3rd ; good-better-best; etc.
Interval data (scale): a type of quantitative (numerical) data. It groups variables into categories and always uses
some kind of ordered scale. Furthermore, interval values are always ordered and separated using an equal
measure of distance.
Example: IQ-tests, income range, age, etc.
Mean Variance Median I.Q.R. Mode Range
Quantitative √ √ √ √ √ √
data
Ordinal data x x √ √ √ √
Nominal x x x x √ √
data
H1.1. Graphs
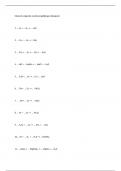
Line Chart
Characteristics:
other names: line plot or line graph
line that connects individual data points.
Quantitative data
interval
Types of Line Charts: simple line graph, multiple line graph and compound line
graph.
Examples of usage: connecting historical data, share valuation, etc.
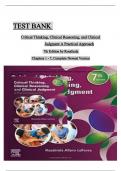
Pie Chart
Characteristics:
each segment represents a category
each segment is a proportion of the whole
Qualitative data
Nominal
Types of Pie Charts: doughnut pie chart, perspective pie chart, exploded pie
chart, polar area diagram, ring chart, Spie chart and square chart
Example of usage: show parts-to-whole relationships,
compare contribution, etc.
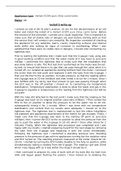
Bar Chart:
Characteristics:
Class intervals / frequencies
bars depict frequencies of different values
Quantitative data
Interval and nominal
Types of Bar Charts: stacked, horizontal, vertical and grouped.
,Example of usage: amount of products, amount of years, amount of
countries
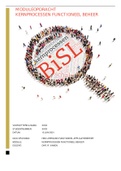
Venn Chart:
Characteristics:
uses circles that overlap or don't overlap to show
the commonalities and differences among things or
groups of things.
Union, sets and intersection
Used in probability calculations
Types of Venn Charts: Two sets, Three sets, Four sets, etc.
Example of usage: common and differentiated trades, common
and differentiated chances of winning
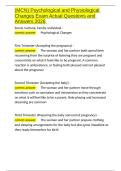
Scatter plot
Characteristics:
uses dots to represent values for two different numeric
variables
shows correlation between two variables (positive, negative
or non-correlated)
shows the strength of the correlation
shows outliers
Quantitative and Qualitative data
Interval, ordinal and nominal
Types of scatter plots: U-shaped, Linear and exponential
Examples:
Box Plot:
Characteristics:
displays the five-number summary of a set of data
minimum, first quartile, median, third quartile and maximum
Box explains the middle 50% of values of a sample/population
Types of data determined: sample symmetry, sample skewness, variance
and outliers
Types of box plots: variable-width and notched
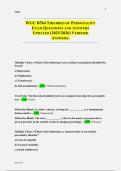
Histogram:
Characteristic:
equal, non-overlapping intervals represented by bars of the same width with no
space between the bars
Class intervals / frequencies
bars depict frequencies of different values
Quantitative data
Interval
Types of histograms: symmetric, skewed (positive or negative), bimodal,
unimodal and probability, bell curve (normal).
Left-skewed: or positively skewed; mode and median > mean
Right-skewed: or negatively skewed; mean > mode and median
Unimodal: distribution with one single peak
Bimodal: distribution with two peaks
, H2. Descriptive statistics
Descriptive statistics summarizes or describes the characteristics of a data set. Descriptive statistics consists of
three basic categories of measures: measures of central tendency, measures of variability (or spread), and
frequency distribution.
Types of descriptive statistics are:
Median
Mode
Mean
Variance
standard deviation
range
frequency distribution
percentile
H2.1. Frequency distribution
Frequency distribution is an organized tabulation/graphical representation of the number of individuals in each
category on the scale of measurement.
Example:
Class width (absolute) Frequency (f) Relative frequency Cumulative relative
frequency
0 - <40 6 6/25 = 0,24 0,24
40 -< 80 8 8/24 = 0,33 (0,24+0,33) = 0,57
80 -< 120 4 4/24 = 0,167 (0,57+0,167) = 0,737
120 -< 160 7 7/24 = 0,263 (0,737+0,263)= 1
Total 25 1 1
Components of the frequency distribution
(1) class width: Class interval ; the difference between the upper limit and lower limit of a class interval
calculation: upper limit – lower limit
(2) frequency: times an observation occurs (e.g. 0-<40 occurs 6 times)
(3) relative frequency: the number of times a particular value for a variable (data item) has been observed
to occur in relation to the total number of values for that variable.
Calculation: frequency / total frequencies
(4) cumulative frequency: the sum of frequencies
(5) frequency density: the frequency per unit for the data in each class.
Calculation: frequency/class width
Note: for every x-value, calculate: fi x Xi (frequency x X-value)
Types of (frequency) tables:
Summary of stati sti cs 1
,Inhoud
Table of Contents
H1. Basics of statistics.............................................................................................................................3
H1.1. Graphs.......................................................................................................................................4
H2. Descriptive statistics.........................................................................................................................6
H2.1. Frequency distribution..............................................................................................................6
H2.2. Center and Spread.....................................................................................................................7
H2.3. Covariance and Correlation.......................................................................................................8
H2.4. combinatorics..........................................................................................................................10
H3. Probability......................................................................................................................................11
H3.1 rules of probability...................................................................................................................12
H3.2. probability tree and table........................................................................................................13
H3.3. Discrete and Continuous probability distribution....................................................................13
H3.4. (hyper)geometric probability distribution...............................................................................14
H3.5. Bernoulli probability distribution............................................................................................15
H3.6. binomial probability distribution.............................................................................................15
H3.7. poisson probability distribution...............................................................................................16
H3.8. normal probability distribution...............................................................................................16
H3.9. uniform distribution................................................................................................................17
H3.10. Student T-distribution............................................................................................................17
H3.11. Approximations.....................................................................................................................18
H3.12. use of probability tables........................................................................................................19
H4. Inferential statistics........................................................................................................................20
H4.1. central limit theorem and basics of inferential statistics.........................................................20
H4.2. central limit theorem and approximation by the normal distribution.....................................21
H4.3. population proportion.............................................................................................................22
H4.4. hypothesis testing...................................................................................................................23
H4.4.1. Steps of Hypothesis testing..............................................................................................23
H4.4.2. right-sided hypothesis test...............................................................................................24
H4.4.3. left-sided hypothesis test..................................................................................................25
H4.4.4. two-sided hypothesis test................................................................................................26
H4.4.5. Hypothesis testing proportions........................................................................................27
H4.4.6. Hypothesis testing by approximation by binomial............................................................28
H4.5. T-distribution and hypothesis testing......................................................................................29
Cheat Sheet..........................................................................................................................................30
Definitions............................................................................................................................................32
,H1. Basics of statistics
Statistics is the study of the collection, analysis, interpretation, presentation, and organization of data. In other
words, it is a mathematical discipline to collect, summarize data.
Branches of statistics:
descriptive statistics: set of methods used to summarize and describe main features of a set.
examples: mean, median, mode, percentile, frequency, variance, range, etc.
probability: a branch of mathematics that deals with the occurrence of a random event
examples: normal distribution, poission distribution, binomial distribution, probability, etc.
inferential statistics: use of measurements of sample groups to make generalizations about the
population.
examples: hypothesis testing, regressions analysis, etc.
To collect, measure and interpretate data, a choice has to be made: measure the whole population or a part of
it.
Population: group of all items that are interested to a statistic practitioner.
Parameter: characteristic that represent a population.
Sample: set of data drawn from the studied population / part of population.
Statistic: characteristics that represent a sample
To conduct an experiment, most practitioners use a (random) sample of the population, to measure, observe
and conclude something about the population. That is why most formula’s in this document conclude both the
formula for a sample experiment and the formula for a population experiment.
Data of an experiment can either be quantitative data or qualitative data.
quantitative data: data where measures of values or counts and are expressed as numbers.
qualitative data: data that cannot be counted, measured or easily expressed using numbers.
Quantitative data Qualitative data
Numerical date Descriptive data
Can be discrete or continuous (interval) Can be ordinal or nominal
Use of number: 1, 300, 8345, etc. Involves 5 senses: taste, feel see, hear and smell
Use of words: red, loud, grey, etc.
Discrete data: a count that involves integers — only a limited number of values is possible.
Example: 3 cats, 4 sisters, etc.
Continuous data: data that can take any value.
Example: 1.63 cm, 78,6 kg, 23,3 degrees, etc.
,Nominal data (scale): data that can be labelled or classified into mutually exclusive categories within a variable.
The order of data doesn’t matter.
Example: 5 red cars, preferred movie, 3 loud bangs
Ordinal data (scale): categorical, statistical data type where the variables have natural, ordered categories.
Example: 1st, 2nd, 3rd ; good-better-best; etc.
Interval data (scale): a type of quantitative (numerical) data. It groups variables into categories and always uses
some kind of ordered scale. Furthermore, interval values are always ordered and separated using an equal
measure of distance.
Example: IQ-tests, income range, age, etc.
Mean Variance Median I.Q.R. Mode Range
Quantitative √ √ √ √ √ √
data
Ordinal data x x √ √ √ √
Nominal x x x x √ √
data
H1.1. Graphs
Line Chart
Characteristics:
other names: line plot or line graph
line that connects individual data points.
Quantitative data
interval
Types of Line Charts: simple line graph, multiple line graph and compound line
graph.
Examples of usage: connecting historical data, share valuation, etc.
Pie Chart
Characteristics:
each segment represents a category
each segment is a proportion of the whole
Qualitative data
Nominal
Types of Pie Charts: doughnut pie chart, perspective pie chart, exploded pie
chart, polar area diagram, ring chart, Spie chart and square chart
Example of usage: show parts-to-whole relationships,
compare contribution, etc.
Bar Chart:
Characteristics:
Class intervals / frequencies
bars depict frequencies of different values
Quantitative data
Interval and nominal
Types of Bar Charts: stacked, horizontal, vertical and grouped.
,Example of usage: amount of products, amount of years, amount of
countries
Venn Chart:
Characteristics:
uses circles that overlap or don't overlap to show
the commonalities and differences among things or
groups of things.
Union, sets and intersection
Used in probability calculations
Types of Venn Charts: Two sets, Three sets, Four sets, etc.
Example of usage: common and differentiated trades, common
and differentiated chances of winning
Scatter plot
Characteristics:
uses dots to represent values for two different numeric
variables
shows correlation between two variables (positive, negative
or non-correlated)
shows the strength of the correlation
shows outliers
Quantitative and Qualitative data
Interval, ordinal and nominal
Types of scatter plots: U-shaped, Linear and exponential
Examples:
Box Plot:
Characteristics:
displays the five-number summary of a set of data
minimum, first quartile, median, third quartile and maximum
Box explains the middle 50% of values of a sample/population
Types of data determined: sample symmetry, sample skewness, variance
and outliers
Types of box plots: variable-width and notched
Histogram:
Characteristic:
equal, non-overlapping intervals represented by bars of the same width with no
space between the bars
Class intervals / frequencies
bars depict frequencies of different values
Quantitative data
Interval
Types of histograms: symmetric, skewed (positive or negative), bimodal,
unimodal and probability, bell curve (normal).
Left-skewed: or positively skewed; mode and median > mean
Right-skewed: or negatively skewed; mean > mode and median
Unimodal: distribution with one single peak
Bimodal: distribution with two peaks
, H2. Descriptive statistics
Descriptive statistics summarizes or describes the characteristics of a data set. Descriptive statistics consists of
three basic categories of measures: measures of central tendency, measures of variability (or spread), and
frequency distribution.
Types of descriptive statistics are:
Median
Mode
Mean
Variance
standard deviation
range
frequency distribution
percentile
H2.1. Frequency distribution
Frequency distribution is an organized tabulation/graphical representation of the number of individuals in each
category on the scale of measurement.
Example:
Class width (absolute) Frequency (f) Relative frequency Cumulative relative
frequency
0 - <40 6 6/25 = 0,24 0,24
40 -< 80 8 8/24 = 0,33 (0,24+0,33) = 0,57
80 -< 120 4 4/24 = 0,167 (0,57+0,167) = 0,737
120 -< 160 7 7/24 = 0,263 (0,737+0,263)= 1
Total 25 1 1
Components of the frequency distribution
(1) class width: Class interval ; the difference between the upper limit and lower limit of a class interval
calculation: upper limit – lower limit
(2) frequency: times an observation occurs (e.g. 0-<40 occurs 6 times)
(3) relative frequency: the number of times a particular value for a variable (data item) has been observed
to occur in relation to the total number of values for that variable.
Calculation: frequency / total frequencies
(4) cumulative frequency: the sum of frequencies
(5) frequency density: the frequency per unit for the data in each class.
Calculation: frequency/class width
Note: for every x-value, calculate: fi x Xi (frequency x X-value)
Types of (frequency) tables: