Lecture 1
Introduction
Preliminaries
We mainly use data obtained from correlation studies.
Research can be exploratory (let the data speak) or confirmatory (replication studies)
o Always involves studying relationships between variables, but kind/type of variable
differ
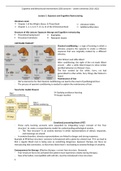
Some are directly measurable/observable = manifest variables
Some are not directly observable, but measured with dedicated instruments
= latent variables
Path models: A first introduction
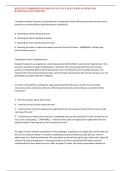
Path model = a hypothesis about underlying causal processes that explain the observed correlations
between two or more variables
When variables are associated, it does not mean that there is a causal relationship; there may also be
a common cause spurious effect.
The goals of a path analysis is to explain why variables correlate.
Investigation of explanatory mechanisms
It is useful to know that variables correlate, for example to predict risks or to take preventive
measures. But more interesting is the question: why do the variables correlate? And in
particular to distinguish sham effects from real effects
Important for theory development, and for the development of effective interventions
Important goal of causal analyzes is to rule out spurious effects.
Global roadmap
1. First introduction – basic concepts and basic elements of path models. Specifically, causal
versus non-causal relationships (spurious relationships)
2. Drawing up path models based on theory and vice versa: deducing the underlying hypotheses
for a path model
3. Methods for estimating the models
4. Types of path models: recursive vs. non-recursive, saturated vs. non-saturated
5. Interpreting path models technically and substantively
6. Methods for assessing the fit of the model to the data
7. Applications within psychological research; how do you assess the quality of the study
,Some basic concepts
Correlational vs. experimental
Experimental = active manipulation of the IVs and random assignment to experimental
conditions.
Correlational = studying coherence between variables obtained from surveys, field
observations. No manipulation has taken place as in (quasi)-experimental research
Variables = properties of research units you are interested in and in which the research units vary
If there is no variation in the variable, then you speak of a constant.
o Notice that whether a property is a variable depends on the specific research
population envisaged
Common mistakes: confusing the values of the variable with the variable itself
o E.g. rich an poor are two values of the same variable income
Basic descriptive statistics
Mean
Variance – measure of dispersion, always positive
Standard deviation – measure of dispersion
Covariance – measure of linear association
o Covariance > 0 = positive association
o Covariance < 0 = negative association
Correlation – standardized measure of linear correlation
Standardized scores
o Z-scores
Mean = 0
SD = 1
Variance = 1
Hypotheses = statements about the supposed relationship between two (or more) variables.
Can be causal or correlational
Five fundamental relations
Building blocks of path model
Each path model can be broken down into fundamental relations
o These basic relationships provide possible explanations for the observed
covariance/correlation between variables
o Thus, these fundamental relationships serve as building blocks for path model
Five fundamental relations:
o Direct effect
o Indirect effect
o Spurious relation
o Unknown effect
o Reciprocal effect
,Direct causal effect
Hypothesis – changes in X causes changes in Y
The reverse does not hold
o A change on Y does not affect X
According to this hypothesis, X is the cause and Y is the effect
Indirect effect
Causal hypothesis – a change in X directly causes a change in M, a
change in M directly causes a change in Y
Result: a change in X causes a change in Y, but this effects flows indirect through M. So,
variable X has an indirect effect on Y
Variable M = mediator, mediates the relationship between X and Y
o Also called the intervening variable
Spurious relation
We assume a direct effect of Z on X, and a direct effect of Z on Y variable Z is a
common cause for both X and Y
Because both X and Y have the same common cause, there is an association
between the two variables. But a change in X has no effect on Y, nor vice versa.
So, it looks as if one affects the other, but it is not true spurious relation
between X and Y
Variable Z = confounder
Correlational research is often aimed at detecting or excluding possible confounders
Societal perspective
o When two variables correlate, there may be causal effect (direct or indirect), but not
necessarily
o You can never rule out 100% that there is a common cause, so you can never prove
causality when using correlational data. But we can try to exclude common causes as
much as possible. The better that succeeds, the stronger our theory
o But also make sure that variables are not (mis)used as an ‘excuse confounder’
A good understanding of, and an eye for, spurious relationships is essential. Not only within this
course but should be a second nature of academics. Why?
Our brains are made to see associations; we must be able to filter what are false associations
and what are real associations. This requires substantive knowledge and methodological
attitude.
Conflating spurious effect for causal effects an have a major social impact.
With the advent of artificial intelligence (AI), which can be used to derive complex patterns
from large data files, this question is even more important.
o Prediction vs explanation
The unknown effect
There is an association between X1 and X2, but we have no theoretical
explanation about the direction of the relationship, could be direct, indirect,
reciprocal….
Unknown (or unspecified) effects are represented by a curved double arrow
The double arrow indicates that we expect a correlation, but we don’t know why (=
unknown)
Double arrows can be read as “there is a correlation”
, Reciprocal effect
A change in X1 causes a change in X2, which in turn causes a change in X1,
which in turn causes X2, etc.
These types of relationships are often used to investigate differences in traits (general
tendency) and states (temporary state)
Very complex relationships to explore. Require (usually) longitudinal data. Is outside scope of
this course.
Summary
Lecture 2
Path model = hypothesis about underlying causal processes that explain the observed correlations
between two or more variables
Path analysis goal = empirically investigate whether causal hypotheses about underlying psychological
processes are supported by the data theory construction and validation applied psychology.
Constructing Path Models
How do we translate a theory into a corresponding path model?
1. List the variables
2. Describe the causal hypotheses between these variables
3. Draw the relationships in a conceptual model
4. A) identify the endogenous variables
B) add disturbance terms to the endogenous variable and draw the correlations between the
exogenous variables
5. Check whether necessary extensions are required apply the ‘golden rule’
Within causal models we distinguish between exogenous and endogenous variables
Exogenous = variable only acts as predictor within the model. It is not explained by other
variables in the model.
o There is no arrow pointing to it
Endogenous = variable is explained by other variables in the model. At least one arrow points
to it. The variable can also itself be a predictor for another variable in the model.
Disturbance terms (unexplained variance)
Not all possible predictors (= causes) are always included in the model.
With every endogenous variable there is residual part; unexplained variance
Introduction
Preliminaries
We mainly use data obtained from correlation studies.
Research can be exploratory (let the data speak) or confirmatory (replication studies)
o Always involves studying relationships between variables, but kind/type of variable
differ
Some are directly measurable/observable = manifest variables
Some are not directly observable, but measured with dedicated instruments
= latent variables
Path models: A first introduction
Path model = a hypothesis about underlying causal processes that explain the observed correlations
between two or more variables
When variables are associated, it does not mean that there is a causal relationship; there may also be
a common cause spurious effect.
The goals of a path analysis is to explain why variables correlate.
Investigation of explanatory mechanisms
It is useful to know that variables correlate, for example to predict risks or to take preventive
measures. But more interesting is the question: why do the variables correlate? And in
particular to distinguish sham effects from real effects
Important for theory development, and for the development of effective interventions
Important goal of causal analyzes is to rule out spurious effects.
Global roadmap
1. First introduction – basic concepts and basic elements of path models. Specifically, causal
versus non-causal relationships (spurious relationships)
2. Drawing up path models based on theory and vice versa: deducing the underlying hypotheses
for a path model
3. Methods for estimating the models
4. Types of path models: recursive vs. non-recursive, saturated vs. non-saturated
5. Interpreting path models technically and substantively
6. Methods for assessing the fit of the model to the data
7. Applications within psychological research; how do you assess the quality of the study
,Some basic concepts
Correlational vs. experimental
Experimental = active manipulation of the IVs and random assignment to experimental
conditions.
Correlational = studying coherence between variables obtained from surveys, field
observations. No manipulation has taken place as in (quasi)-experimental research
Variables = properties of research units you are interested in and in which the research units vary
If there is no variation in the variable, then you speak of a constant.
o Notice that whether a property is a variable depends on the specific research
population envisaged
Common mistakes: confusing the values of the variable with the variable itself
o E.g. rich an poor are two values of the same variable income
Basic descriptive statistics
Mean
Variance – measure of dispersion, always positive
Standard deviation – measure of dispersion
Covariance – measure of linear association
o Covariance > 0 = positive association
o Covariance < 0 = negative association
Correlation – standardized measure of linear correlation
Standardized scores
o Z-scores
Mean = 0
SD = 1
Variance = 1
Hypotheses = statements about the supposed relationship between two (or more) variables.
Can be causal or correlational
Five fundamental relations
Building blocks of path model
Each path model can be broken down into fundamental relations
o These basic relationships provide possible explanations for the observed
covariance/correlation between variables
o Thus, these fundamental relationships serve as building blocks for path model
Five fundamental relations:
o Direct effect
o Indirect effect
o Spurious relation
o Unknown effect
o Reciprocal effect
,Direct causal effect
Hypothesis – changes in X causes changes in Y
The reverse does not hold
o A change on Y does not affect X
According to this hypothesis, X is the cause and Y is the effect
Indirect effect
Causal hypothesis – a change in X directly causes a change in M, a
change in M directly causes a change in Y
Result: a change in X causes a change in Y, but this effects flows indirect through M. So,
variable X has an indirect effect on Y
Variable M = mediator, mediates the relationship between X and Y
o Also called the intervening variable
Spurious relation
We assume a direct effect of Z on X, and a direct effect of Z on Y variable Z is a
common cause for both X and Y
Because both X and Y have the same common cause, there is an association
between the two variables. But a change in X has no effect on Y, nor vice versa.
So, it looks as if one affects the other, but it is not true spurious relation
between X and Y
Variable Z = confounder
Correlational research is often aimed at detecting or excluding possible confounders
Societal perspective
o When two variables correlate, there may be causal effect (direct or indirect), but not
necessarily
o You can never rule out 100% that there is a common cause, so you can never prove
causality when using correlational data. But we can try to exclude common causes as
much as possible. The better that succeeds, the stronger our theory
o But also make sure that variables are not (mis)used as an ‘excuse confounder’
A good understanding of, and an eye for, spurious relationships is essential. Not only within this
course but should be a second nature of academics. Why?
Our brains are made to see associations; we must be able to filter what are false associations
and what are real associations. This requires substantive knowledge and methodological
attitude.
Conflating spurious effect for causal effects an have a major social impact.
With the advent of artificial intelligence (AI), which can be used to derive complex patterns
from large data files, this question is even more important.
o Prediction vs explanation
The unknown effect
There is an association between X1 and X2, but we have no theoretical
explanation about the direction of the relationship, could be direct, indirect,
reciprocal….
Unknown (or unspecified) effects are represented by a curved double arrow
The double arrow indicates that we expect a correlation, but we don’t know why (=
unknown)
Double arrows can be read as “there is a correlation”
, Reciprocal effect
A change in X1 causes a change in X2, which in turn causes a change in X1,
which in turn causes X2, etc.
These types of relationships are often used to investigate differences in traits (general
tendency) and states (temporary state)
Very complex relationships to explore. Require (usually) longitudinal data. Is outside scope of
this course.
Summary
Lecture 2
Path model = hypothesis about underlying causal processes that explain the observed correlations
between two or more variables
Path analysis goal = empirically investigate whether causal hypotheses about underlying psychological
processes are supported by the data theory construction and validation applied psychology.
Constructing Path Models
How do we translate a theory into a corresponding path model?
1. List the variables
2. Describe the causal hypotheses between these variables
3. Draw the relationships in a conceptual model
4. A) identify the endogenous variables
B) add disturbance terms to the endogenous variable and draw the correlations between the
exogenous variables
5. Check whether necessary extensions are required apply the ‘golden rule’
Within causal models we distinguish between exogenous and endogenous variables
Exogenous = variable only acts as predictor within the model. It is not explained by other
variables in the model.
o There is no arrow pointing to it
Endogenous = variable is explained by other variables in the model. At least one arrow points
to it. The variable can also itself be a predictor for another variable in the model.
Disturbance terms (unexplained variance)
Not all possible predictors (= causes) are always included in the model.
With every endogenous variable there is residual part; unexplained variance