MICROECONOMICS DIAGRAMS
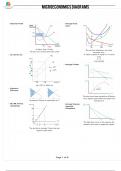
1. Abnormal Profit 5. Average Fixed
Costs
At Qpm, Ppm > Pcost The red line diminishes, but never
All costs are covered and then some! becomes zero.
2. ad valorem tax "a" (blue to green) is equal to "c" (red to
axis)
b=d
(c/q1)=(d/q2)
6. Average Product
eg a VAT or sales tax
3. Allocative
Efficiency
The blue line shows productive efficiency
at its highest point (where the green line
Community Surplus is maximized at P* intersects it)
4. AR, MR: Perfect 7. Average Revenue:
Competition Imperfect
Competition
The light blue curve is the same as the
demand curve and is negatively sloped.
The red line is actually 2 lines that are
equal to each other.
Page 1 of 9
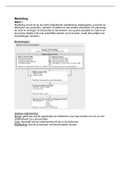
, 8. Average 12. Change in Demand
Revenue: Non-
Collusive
Oligopoly
The green curve is relatively elastic at E.G. due to a new marketing campaign.
prices above Ppm and relatively inelastic
13. Change in Quantity
at prices below Ppm.
Demanded
9. Average Total
Costs
Due to a change in supply.
14. Change in Quantity
Supplied
The blue line is the sum of the green and
red lines.
10. Average Variable
Costs
Due to a change in Demand.
15. Change in Supply
The green line decreases, then increases
due to the law of eventually diminishing
marginal returns.
It gets closer to the blue line, but will
never touch it.
11. Break- Even
Profit
E.G. due to an improvement of
technology
At Qpm, Ppm=Pcost
All costs are covered, with no extra
Page 2 of 9
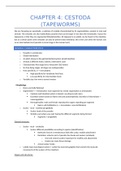
1. Abnormal Profit 5. Average Fixed
Costs
At Qpm, Ppm > Pcost The red line diminishes, but never
All costs are covered and then some! becomes zero.
2. ad valorem tax "a" (blue to green) is equal to "c" (red to
axis)
b=d
(c/q1)=(d/q2)
6. Average Product
eg a VAT or sales tax
3. Allocative
Efficiency
The blue line shows productive efficiency
at its highest point (where the green line
Community Surplus is maximized at P* intersects it)
4. AR, MR: Perfect 7. Average Revenue:
Competition Imperfect
Competition
The light blue curve is the same as the
demand curve and is negatively sloped.
The red line is actually 2 lines that are
equal to each other.
Page 1 of 9
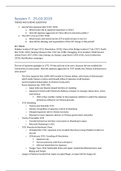
, 8. Average 12. Change in Demand
Revenue: Non-
Collusive
Oligopoly
The green curve is relatively elastic at E.G. due to a new marketing campaign.
prices above Ppm and relatively inelastic
13. Change in Quantity
at prices below Ppm.
Demanded
9. Average Total
Costs
Due to a change in supply.
14. Change in Quantity
Supplied
The blue line is the sum of the green and
red lines.
10. Average Variable
Costs
Due to a change in Demand.
15. Change in Supply
The green line decreases, then increases
due to the law of eventually diminishing
marginal returns.
It gets closer to the blue line, but will
never touch it.
11. Break- Even
Profit
E.G. due to an improvement of
technology
At Qpm, Ppm=Pcost
All costs are covered, with no extra
Page 2 of 9