SUMMARY MRM1
Week 1
1. Data
Unit = what/who you are measuring
Variable = how you are measuring
Example: Unit = student, variable = grade and group
Levels of measurement:
1. Categorical
a) Binary variable = 2 outcomes (dead or alive, yes or no).
b) Ordinal variable = with ranking “order” (good, better, best).
c) Nominal variable = a lot of options, with no order (blood type, eye color, zip code).
2. Numerical
a) Discrete data = always a whole number (amount of children, age, number of
employees).
b) Continuous data = can have any number (height, weight, temperature, length).
Numerical data contain more information than categorical data. As a result, you need larger
samples for categorical data with less information.
Measurement errors:
- Systematic measurement error (bias) = a consistent or proportional difference
between the observed and true values of something. Difference between the
average measurement result and the true value.
- Random measurement error = (more of a concern) you can’t correct it because
you don’t know where it’s wrong. Unsystematic deviations due to imprecision of
the measurement syste
,2. Data Analysis
Location
- Median = middle number in ordered data
- Mean = average
- Mode = most frequent score
Dispersion
- Range = max – min. (! Very sensitive to outliers)
- Interquartile range = upper – lower quartile (Q3 – Q1) = range of middle 50% of data
- Variance = (alles – gemiddelde)2 + elkaar / aantal getallen – 1
= De mate waarin de waarden onderling verschillen. Hoe groter de variantie, hoe
meer de afzonderlijke waarden onderling verschillen, en dus ook hoe meer de
waarden van het “gemiddelde afwijken”
- Standarddeviation = √ variance
= How far approximately away from the average.
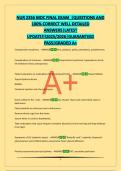
Skewness
Positive skewness your mean is higher than the median.
Negative skewness your mean is lower than your median.
, Bimodal = 2 models
Multimodal = having several models
3. Plotting Data
Categorical data:
- Bar chart (best way!)
- Pie chart
Numerical data:
- Histogram
- Boxplot
Two categorical variables:
- Multiple bars
Two numerical variables:
- Scatterplot
One numerical and one categorical variable:
- Boxplot
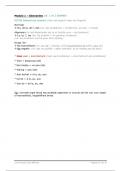
Scatterplot going up = positive relation, going down = negative relation. Random = no
relation.
Positive relation:
Week 1
1. Data
Unit = what/who you are measuring
Variable = how you are measuring
Example: Unit = student, variable = grade and group
Levels of measurement:
1. Categorical
a) Binary variable = 2 outcomes (dead or alive, yes or no).
b) Ordinal variable = with ranking “order” (good, better, best).
c) Nominal variable = a lot of options, with no order (blood type, eye color, zip code).
2. Numerical
a) Discrete data = always a whole number (amount of children, age, number of
employees).
b) Continuous data = can have any number (height, weight, temperature, length).
Numerical data contain more information than categorical data. As a result, you need larger
samples for categorical data with less information.
Measurement errors:
- Systematic measurement error (bias) = a consistent or proportional difference
between the observed and true values of something. Difference between the
average measurement result and the true value.
- Random measurement error = (more of a concern) you can’t correct it because
you don’t know where it’s wrong. Unsystematic deviations due to imprecision of
the measurement syste
,2. Data Analysis
Location
- Median = middle number in ordered data
- Mean = average
- Mode = most frequent score
Dispersion
- Range = max – min. (! Very sensitive to outliers)
- Interquartile range = upper – lower quartile (Q3 – Q1) = range of middle 50% of data
- Variance = (alles – gemiddelde)2 + elkaar / aantal getallen – 1
= De mate waarin de waarden onderling verschillen. Hoe groter de variantie, hoe
meer de afzonderlijke waarden onderling verschillen, en dus ook hoe meer de
waarden van het “gemiddelde afwijken”
- Standarddeviation = √ variance
= How far approximately away from the average.
Skewness
Positive skewness your mean is higher than the median.
Negative skewness your mean is lower than your median.
, Bimodal = 2 models
Multimodal = having several models
3. Plotting Data
Categorical data:
- Bar chart (best way!)
- Pie chart
Numerical data:
- Histogram
- Boxplot
Two categorical variables:
- Multiple bars
Two numerical variables:
- Scatterplot
One numerical and one categorical variable:
- Boxplot
Scatterplot going up = positive relation, going down = negative relation. Random = no
relation.
Positive relation: