Empirical Methods in Finance
Block 1 - Event studies
• Event study: test of the change in stock or bond prices around specific “events”. Goal:
- Examine magnitude of some event on the wealth of the security holder
- To test that the market efficiently incorporates new information (EMH)
Efficient Market Hypothesis (EMH)
• Efficient market: market where prices always fully reflect available and relevant information
- Efficiency: two aspects of price adjustment: speed and quality of adjustment (direction and
magnitude)
• Weak ME: prices reflect all information contained in the record of past
- Return predictability
• Semi-strong ME: prices reflect past and all other published information
- Stock reaction on the day the announcement is made
• Strong ME: prices reflect public and private information
- Not suitable for event studies, don’t know the private information
Conducting an event study: Main steps
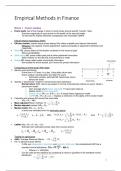
1. Identify event and timing
- Event time: t=0, every t is a day. Using daily return data
- Event window: starting before and after the event
o Estimation window: estimate NR, benchmark return,
before the event
2. Specify a “benchmark” model for normal stock return behaviour
- Normal return (NR): returns we expect in normal circumstances without an event. Need a
benchmark model:
o Own average return (mean adjusted) → inaccurate measure
o Market return (market adjusted)
o Market model (Rit= α + βi Rmt + eit) → simple linear regression model
o CAPM (Rit – Rft = βi + eit) -> imposes a restriction on the alpha of the market model
3. Calculate and analyse AR around the event date
- ARit = Rit – NRit
• Mean adjusted Return method:
• Market adjusted method: NRit = Rmt
• Market model: NRit = 𝛼̂𝑖 + 𝛽𝑖
̂ Rmt
- α and β are estimated over the estimation period
With And
• ̂ (Rmt – Rft)
CAPM: NRit = Rft + 𝛽𝑖
- Estimate over estimation period, beta from excess returns:
Testing for significance
• AAR= Average Abnormal Return
• H0: no abnormal price effects
- If ARs are independent, identically and normally distributed, the standardized AAR has a
𝑨𝑨𝑹𝒕
standard normal distribution: TS1= √𝑵 ~ N(0,1)
𝝈
o Where σ2 = VAR(ARit)
- Can be used as test statistics by comparing its value to quantiles of the standard normal
distribution
1
, • Estimate σ:
- σ is unknown: it is challenging to estimate the precise impact of an event on asset prices on
beforehand
𝑨𝑨𝑹𝒕
• Test for AR using t-statistic: TS1= √𝑵
𝑺𝒕
• Central Limit Theorem: for large N the t-statistic has approximately a standard normal distribution.
- N>30
Cumulative Abnormal Returns
• CAR over a window around the event and the outperformance measured by CAAR:
• Calculate CAR from the start of the event period to any day t ≤ t2 and CAAR for day t:
𝑪𝑨𝑨𝑹
• T-test: TS2= √𝑵 ≈ N(0,1) where
𝑺
Complications
• Event induced variance:
- Higher variance at or around event date, making it challenging to estimate their impact
accurately
- Cross-section estimators of standard deviation are robust against this
• Event clustering: multiple events in the same calendar time period.
- Induces cross-sectional correlation → makes t-test invalid
- Good benchmark often solves this problem, if not there are 2 solutions:
o Average all returns of the same calendar day into a portfolio return an treat as one
observation in the t-test
o Crude dependence adjustment of standard error: Estimating the variance of the
AAR directly from the time series of observations of AAR in the estimation period:
▪ where AR* is overall average of AR over the
estimation period
𝑨𝑨𝑹
▪ Test statistics now: TS5= ̅
≈ N(0,1)
𝑺
• Non-normality of return distribution:
- Skewness and outliers, mainly in small samples
- Rank or sign tests perform better than t-test
- Sign test: look whether returns are positive or negative
o More robust against outliers
o p= fraction of positive returns
o H0: E(p)=0.5
o TS9= 𝟐√𝑵 (p-0.5) ≈ N(0,1)
- Rank test: rank all returns if firm i in the estimation period + event period (lowest to highest)
o Ui: rank of the event-day returns on firm i in the full distribution of returns
o H0: E(Ui)=0.5
o where sut= SD of Ui
Long horizon event studies
• For long horizon event studies, IPO & SEO, use the Buy-and-hold abnormal returns (BHAR):
- . instead of using:
-
- BHAR gives a compounding effect over months (H) and implies the construction of portfolios
and keeping them until the end of the event period
- CAR assumes a monthly rebalancing of an equally weighted portfolio
2
Block 1 - Event studies
• Event study: test of the change in stock or bond prices around specific “events”. Goal:
- Examine magnitude of some event on the wealth of the security holder
- To test that the market efficiently incorporates new information (EMH)
Efficient Market Hypothesis (EMH)
• Efficient market: market where prices always fully reflect available and relevant information
- Efficiency: two aspects of price adjustment: speed and quality of adjustment (direction and
magnitude)
• Weak ME: prices reflect all information contained in the record of past
- Return predictability
• Semi-strong ME: prices reflect past and all other published information
- Stock reaction on the day the announcement is made
• Strong ME: prices reflect public and private information
- Not suitable for event studies, don’t know the private information
Conducting an event study: Main steps
1. Identify event and timing
- Event time: t=0, every t is a day. Using daily return data
- Event window: starting before and after the event
o Estimation window: estimate NR, benchmark return,
before the event
2. Specify a “benchmark” model for normal stock return behaviour
- Normal return (NR): returns we expect in normal circumstances without an event. Need a
benchmark model:
o Own average return (mean adjusted) → inaccurate measure
o Market return (market adjusted)
o Market model (Rit= α + βi Rmt + eit) → simple linear regression model
o CAPM (Rit – Rft = βi + eit) -> imposes a restriction on the alpha of the market model
3. Calculate and analyse AR around the event date
- ARit = Rit – NRit
• Mean adjusted Return method:
• Market adjusted method: NRit = Rmt
• Market model: NRit = 𝛼̂𝑖 + 𝛽𝑖
̂ Rmt
- α and β are estimated over the estimation period
With And
• ̂ (Rmt – Rft)
CAPM: NRit = Rft + 𝛽𝑖
- Estimate over estimation period, beta from excess returns:
Testing for significance
• AAR= Average Abnormal Return
• H0: no abnormal price effects
- If ARs are independent, identically and normally distributed, the standardized AAR has a
𝑨𝑨𝑹𝒕
standard normal distribution: TS1= √𝑵 ~ N(0,1)
𝝈
o Where σ2 = VAR(ARit)
- Can be used as test statistics by comparing its value to quantiles of the standard normal
distribution
1
, • Estimate σ:
- σ is unknown: it is challenging to estimate the precise impact of an event on asset prices on
beforehand
𝑨𝑨𝑹𝒕
• Test for AR using t-statistic: TS1= √𝑵
𝑺𝒕
• Central Limit Theorem: for large N the t-statistic has approximately a standard normal distribution.
- N>30
Cumulative Abnormal Returns
• CAR over a window around the event and the outperformance measured by CAAR:
• Calculate CAR from the start of the event period to any day t ≤ t2 and CAAR for day t:
𝑪𝑨𝑨𝑹
• T-test: TS2= √𝑵 ≈ N(0,1) where
𝑺
Complications
• Event induced variance:
- Higher variance at or around event date, making it challenging to estimate their impact
accurately
- Cross-section estimators of standard deviation are robust against this
• Event clustering: multiple events in the same calendar time period.
- Induces cross-sectional correlation → makes t-test invalid
- Good benchmark often solves this problem, if not there are 2 solutions:
o Average all returns of the same calendar day into a portfolio return an treat as one
observation in the t-test
o Crude dependence adjustment of standard error: Estimating the variance of the
AAR directly from the time series of observations of AAR in the estimation period:
▪ where AR* is overall average of AR over the
estimation period
𝑨𝑨𝑹
▪ Test statistics now: TS5= ̅
≈ N(0,1)
𝑺
• Non-normality of return distribution:
- Skewness and outliers, mainly in small samples
- Rank or sign tests perform better than t-test
- Sign test: look whether returns are positive or negative
o More robust against outliers
o p= fraction of positive returns
o H0: E(p)=0.5
o TS9= 𝟐√𝑵 (p-0.5) ≈ N(0,1)
- Rank test: rank all returns if firm i in the estimation period + event period (lowest to highest)
o Ui: rank of the event-day returns on firm i in the full distribution of returns
o H0: E(Ui)=0.5
o where sut= SD of Ui
Long horizon event studies
• For long horizon event studies, IPO & SEO, use the Buy-and-hold abnormal returns (BHAR):
- . instead of using:
-
- BHAR gives a compounding effect over months (H) and implies the construction of portfolios
and keeping them until the end of the event period
- CAR assumes a monthly rebalancing of an equally weighted portfolio
2