SPSS - Technieken voor causale analyse
Inhoud
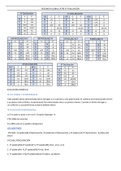
ANOVA Pagina 2
ANOVA (assumptions) Pagina 3
ANOVA (one-way) Pagina 3
Bivariate regression analysis Pagina 6
Collinearity diagnostics Pagina 7
Descriptives function Pagina 2
Dummy variables (recoding) Pagina 5
Frequent distribution for the variable Pagina 2
Histogram (create) Pagina 3
Levene’s test Pagina 3
Mean function Pagina 2
Missing 9/-systems Pagina 5
Missing values (how to find them) Pagina 5
Multicollinearity Pagina 7
New datafile (only contains needed variables) Pagina 5
New syntax file Pagina 2
Notes exercise book Pagina 10
Path model Pagina 8
Pearson Correlation Pagina 4
R squared change Pagina 7
Residual score (generate for each variable) Pagina 6
Scatterplot (create) Pagina 4
Scatterplot (out of more independent variables) Pagina 6
Sequential logistic regression analysis Pagina 9
Sequential regression analysis Pagina 7
Subset means selection Pagina 4
Notes exercisebook bestaat uit de onderdelen:
1. One-Way Between-Subjects ANOVA
2. Bivariate and Partial Correlation
3. Bivariate OLS Regression Analysis
4. Multiple OLS Regression Analysis and Sequential Regression Analysis
5. OLS Regression with Dummy Variables
6. OLS Regression with Interaction Terms (Moderation Analysis)
7. Estimate Path models with OLS Regression
8. Binary Logistic Regression
Pagina 1 van 20
,Practical 1 – ANOVA & Pearson Correlation
Assignment 1: The Basics (Syntax & Descriptives)
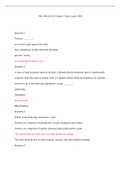
ANOVA analyseert verhouding van de twee componenten van totale varia(n)tie in de data –
tussengroepvariantie en binnengroepvariantie:
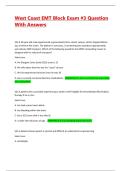
Pearson’s correlatiecoefficient r is een gestandaardiseerde maat voor de lineaire samenhang tussen
2 continu (of dichotome*) variabelen
New syntax file
File → New → Syntax
Click on the Paste button instead of the Ok button → will add command to the bottom of the
original file. You do not have to make a new file for each analysis. In order to run the command you
created, select the piece of syntax in the syntax file and run it (CTRL+R).
Generating a frequency distribution for the variable
Analyze → Descriptive Statistics → Frequencies
Remember to use the Paste button and run the syntax!
➔ Ook handig voor missing variables!!!
A frequency function is not very useful for continuous variables, a better alternative is using summary
statistics, such as the mean, median, and variance → Descriptives function.
Descriptives function
Analyze → Descriptive Statistics → Descriptives (→ Paste → Run)
If one or more of the statistics are missing, go to the Statistics tab in the descriptive screen and make
sure all relevant boxes are ticked before pasting your syntax (using options)!
Another way to find the mean is using the Means function.
Means function
Analyze → Compare Means and Proportions → Means → Select variable → Paste → Run
Dependent list if you just want to know the mean of the sample, independent list (layer 1 of 1) when
you want to know the mean for different categories.
Pagina 2 van 20
, Assignment 2: ANOVA
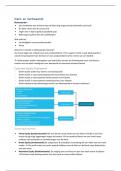
Assumptions of an ANOVA
- Correct measurement level of the X and Y variables
- Normal distributions of scores on the Y variable (for the full dataset, and within each group)
- No outliers
- Approximately equal variances in all the groups
- The observations should be independent (within- and between groups)
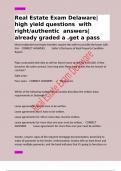
Checking the normality assumption of the Y variable is often done visually through a histogram.
A histogram is a bar-graph where the range of continuous scores on a variable are grouped into
(small) categories on the X-axis (horizontal). The frequency count of these categories are plotted on
the Y-axis (vertical) to see how often different values occur.
Making a Histogram
Navigate to Graphs → Histogram
- Plot a histogram for the variable by adding it to the Variables box.
- If you want to know whether the dependent variable is normally distributed within different
groups, we should add the other variable in the Columns box.
- ALSO tick the box Display normal curve in the dialog window, to have SPSS show a reference
line in the graph.
- Paste and run the syntax
- You will see different histograms.
One-Way ANOVA
looking between companies
Analyze → Compare Means and Proportions→ One-Way ANOVA
- Enter the dependent variable and the independent variable (= the factor) that indicates the
different groups
- Paste and run the syntax
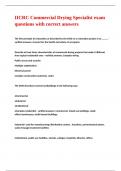
Levene’s test
For homogeneity of variances
Analyze → Compare Means and Proportions → One-Way ANOVA
- Enter the dependent variable and the independent variable (= the factor) that indicates the
different groups
- Click on the Options button and check the box for Homogeneity of variance test
- Paste and run the syntax
P < 0.05 wel significant, anders niet!
When variables are insignificant, the variances do not differ significantly from each other.
Pagina 3 van 20
Inhoud
ANOVA Pagina 2
ANOVA (assumptions) Pagina 3
ANOVA (one-way) Pagina 3
Bivariate regression analysis Pagina 6
Collinearity diagnostics Pagina 7
Descriptives function Pagina 2
Dummy variables (recoding) Pagina 5
Frequent distribution for the variable Pagina 2
Histogram (create) Pagina 3
Levene’s test Pagina 3
Mean function Pagina 2
Missing 9/-systems Pagina 5
Missing values (how to find them) Pagina 5
Multicollinearity Pagina 7
New datafile (only contains needed variables) Pagina 5
New syntax file Pagina 2
Notes exercise book Pagina 10
Path model Pagina 8
Pearson Correlation Pagina 4
R squared change Pagina 7
Residual score (generate for each variable) Pagina 6
Scatterplot (create) Pagina 4
Scatterplot (out of more independent variables) Pagina 6
Sequential logistic regression analysis Pagina 9
Sequential regression analysis Pagina 7
Subset means selection Pagina 4
Notes exercisebook bestaat uit de onderdelen:
1. One-Way Between-Subjects ANOVA
2. Bivariate and Partial Correlation
3. Bivariate OLS Regression Analysis
4. Multiple OLS Regression Analysis and Sequential Regression Analysis
5. OLS Regression with Dummy Variables
6. OLS Regression with Interaction Terms (Moderation Analysis)
7. Estimate Path models with OLS Regression
8. Binary Logistic Regression
Pagina 1 van 20
,Practical 1 – ANOVA & Pearson Correlation
Assignment 1: The Basics (Syntax & Descriptives)
ANOVA analyseert verhouding van de twee componenten van totale varia(n)tie in de data –
tussengroepvariantie en binnengroepvariantie:
Pearson’s correlatiecoefficient r is een gestandaardiseerde maat voor de lineaire samenhang tussen
2 continu (of dichotome*) variabelen
New syntax file
File → New → Syntax
Click on the Paste button instead of the Ok button → will add command to the bottom of the
original file. You do not have to make a new file for each analysis. In order to run the command you
created, select the piece of syntax in the syntax file and run it (CTRL+R).
Generating a frequency distribution for the variable
Analyze → Descriptive Statistics → Frequencies
Remember to use the Paste button and run the syntax!
➔ Ook handig voor missing variables!!!
A frequency function is not very useful for continuous variables, a better alternative is using summary
statistics, such as the mean, median, and variance → Descriptives function.
Descriptives function
Analyze → Descriptive Statistics → Descriptives (→ Paste → Run)
If one or more of the statistics are missing, go to the Statistics tab in the descriptive screen and make
sure all relevant boxes are ticked before pasting your syntax (using options)!
Another way to find the mean is using the Means function.
Means function
Analyze → Compare Means and Proportions → Means → Select variable → Paste → Run
Dependent list if you just want to know the mean of the sample, independent list (layer 1 of 1) when
you want to know the mean for different categories.
Pagina 2 van 20
, Assignment 2: ANOVA
Assumptions of an ANOVA
- Correct measurement level of the X and Y variables
- Normal distributions of scores on the Y variable (for the full dataset, and within each group)
- No outliers
- Approximately equal variances in all the groups
- The observations should be independent (within- and between groups)
Checking the normality assumption of the Y variable is often done visually through a histogram.
A histogram is a bar-graph where the range of continuous scores on a variable are grouped into
(small) categories on the X-axis (horizontal). The frequency count of these categories are plotted on
the Y-axis (vertical) to see how often different values occur.
Making a Histogram
Navigate to Graphs → Histogram
- Plot a histogram for the variable by adding it to the Variables box.
- If you want to know whether the dependent variable is normally distributed within different
groups, we should add the other variable in the Columns box.
- ALSO tick the box Display normal curve in the dialog window, to have SPSS show a reference
line in the graph.
- Paste and run the syntax
- You will see different histograms.
One-Way ANOVA
looking between companies
Analyze → Compare Means and Proportions→ One-Way ANOVA
- Enter the dependent variable and the independent variable (= the factor) that indicates the
different groups
- Paste and run the syntax
Levene’s test
For homogeneity of variances
Analyze → Compare Means and Proportions → One-Way ANOVA
- Enter the dependent variable and the independent variable (= the factor) that indicates the
different groups
- Click on the Options button and check the box for Homogeneity of variance test
- Paste and run the syntax
P < 0.05 wel significant, anders niet!
When variables are insignificant, the variances do not differ significantly from each other.
Pagina 3 van 20