Summary Quantitative and Design Methods in Business
Research
Table of contents
Week 1 – Introduction ...................................................................................................................... 2
Week 1 – Video on Design & Behavioral Research................................................................. 12
Week 1 – Principal Component Analysis & Exploratory Factor Analysis ......................... 23
Week 1 – Guest Lecture PWC: Slides (info for week 2) ......................................................... 41
Week 2 – Regression Analysis (Technique Lecture) .............................................................. 49
Week 3 – Analysis of (Co-)Variance (Technical Lecture) ...................................................... 69
Week 4 – Video on Structural Equation Modeling (Composite-Based SEM) ................... 81
1
,Week 1 – Introduction
Basic Concepts of Multivariate Data Analysis
After this lecture, you should be able to do the following:
1. Explain what multivariate analysis is and when its application is appropriate.
2. Define and discuss the specific techniques included in multivariate analysis.
3. Determine which multivariate technique is appropriate for a specific research problem.
4. Discuss the nature of measurement scales and their relationship to multivariate techniques.
5. Describe the conceptual and statistical issues inherent in multivariate analyses.
Multivariate Analysis
Multivariate Data analysis comprises all statistical methods that simultaneously analyze multiple
measurements on each individual or object under investigation.
• Means we collect data from individuals
• Multivariate analysis can be conducted when two or more variables are measured
o Why? Because then you can look for patterns and relationships between these variables
o So each subject should have more variables
Motivation for conducting multivariate analysis:
• Measurement
• Explanation & Prediction
• Hypothesis Testing
The construct intelligence is a variable that is hard to measure. So you have multiple variables that
measure intelligence.
Basic concepts of multivariate analysis
• There are different measurement scales
o Nonmetric
o Metric
• Measurement and measurement error
• Statistical inference
• Types of techniques
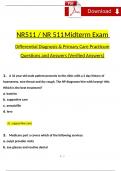
Types of Data and Measurement Scales
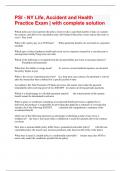
• Nonmetric or qualitative
o Nominal = size of number is not related to
the amount of the characteristic being
measured
o Ordinal = larger numbers indicate more (or
less) of the characteristic being measured,
but not how much more (or less)
• Metric or quantitative
o Interval = contains ordinal properties, and in
addition, there are equal differences
between scale points
o Ratio = contains interval scale properties, and in addition, there is a natural zero point.
The level of measurement is critical in determining the appropriate multivariate technique to use.
2
,*Sometimes the data are stored as integers à this is a variable with values 1, 2, 3, 4, 5, but never 1.5
In a data table, usually=
• Row = subject
• Column = 1 variables
Measurement Error
• All variables have some error. When measuring something there is always some mistakes and errors.
• Measurement error = distorts observed relationships and makes multivariate techniques less
powerful.
• Researchers use summated scales, for which several variables are summed or averaged together to
form a composite representation of a concept
Because measurement errors distort
the results, we have to do something
about it.
The more error you have, the less
certainty you have about your
phenomena and relationships between
phenomena.
In statistics less chance t find an effect.
è Try to accommodate for this, by not relying on a single variable but to measure the same thing
several times and than create an average of it.
è Quantify the amount of error and correct them for the error you have. You can only do that when
you know how much error and the kind of error. In order to do this, distinguish two types of error=
o Random error
o Systematic error
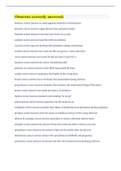
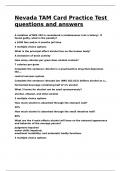
Measurement error consists of random error and systematic error.
• Random error = is a chance difference between the observed and
true values of something (e.g., a researcher misreading a weighing
scale records an incorrect measurement). = fuzzy error
• Systematic error = is a consistent or proportional difference
between the observed and true values of something (e.g., a
miscalibrated scale consistently registers weights as
higher than they actually are). Thus, there is systematic reason why
you measure the wrong thing, for example respondence
systematically under- or overrated.
By recognizing the sources of error, you can reduce their impacts and
record accurate and precise measurements.
àWe want to talk about reliable and valid measurement
3
, In addressing measurement error, researchers evaluate two important characteristics of measurement:
• Reliability = the observed variable’s degree of precision (reproducibility of results) and thus the lack
of random measurement error.
• Validity = the degree to which a measure accurately represents what it is supposed to.
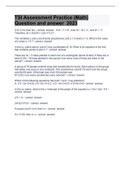
Statistical Significance and Power
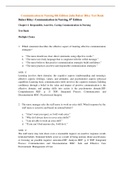
Two types of errors can occur:
• Type I error, or α, is the probability of
rejecting the null hypothesis when it is
true.
o If the null hypothesis is true, but
we reject it.
• Type II error, or β, is the probability of
failing to reject the null hypothesis when it
is false.
o Although the effect is there, you fail to identify such, you have no sufficient evidence for
that.
• Power, or 1-β, is the probability of rejecting the null hypothesis when it is false.
Typical alpha α level = 5%. The significance level, also denoted as alpha or α, is the probability of
rejecting the null hypothesis when it is true. For example, a significance level of 0.05 indicates a 5% risk
of concluding that a difference exists when there is no actual difference.
Typical level of beta β risk = 20%. The probability of making a type II error (failing to reject the null
hypothesis when it is actually false).
The quantity (1 - β) is called power, the probability of observing an effect in the sample (if one), of a
specified effect size or greater exists in the population.
è The more stricter you are with alpha, the more leaner you have to be with Beta and the other way
around.
Er kunnen zich twee soorten fouten voordoen:
- Type I fout, of α, is de kans op verwerping van de nulhypothese wanneer deze waar is.
- Type II fout, of β, is de kans dat de nulhypothese niet wordt verworpen wanneer zij onjuist is.
- Power, of 1-β, is de kans dat de nulhypothese wordt verworpen wanneer deze onjuist is.
Statistical Significance and Power
• Effect size: the actual magnitude of the effect of interest (e.g., the difference between means or the
correlation between variables).
• Alpha (α): as α is set at smaller levels, power decreases. Typically, α = .05
• Sample size: as sample size increases, power increases. With very large sample sizes, even very
small effects can be statistically significant, raising the issue of practical significance vs. statistical
significance.
- Survey bias = systematic error is measurement error. Measurement error reduces the possibility
of finding an effect.
- The higher the measurement error the smaller the Beta.
4
Research
Table of contents
Week 1 – Introduction ...................................................................................................................... 2
Week 1 – Video on Design & Behavioral Research................................................................. 12
Week 1 – Principal Component Analysis & Exploratory Factor Analysis ......................... 23
Week 1 – Guest Lecture PWC: Slides (info for week 2) ......................................................... 41
Week 2 – Regression Analysis (Technique Lecture) .............................................................. 49
Week 3 – Analysis of (Co-)Variance (Technical Lecture) ...................................................... 69
Week 4 – Video on Structural Equation Modeling (Composite-Based SEM) ................... 81
1
,Week 1 – Introduction
Basic Concepts of Multivariate Data Analysis
After this lecture, you should be able to do the following:
1. Explain what multivariate analysis is and when its application is appropriate.
2. Define and discuss the specific techniques included in multivariate analysis.
3. Determine which multivariate technique is appropriate for a specific research problem.
4. Discuss the nature of measurement scales and their relationship to multivariate techniques.
5. Describe the conceptual and statistical issues inherent in multivariate analyses.
Multivariate Analysis
Multivariate Data analysis comprises all statistical methods that simultaneously analyze multiple
measurements on each individual or object under investigation.
• Means we collect data from individuals
• Multivariate analysis can be conducted when two or more variables are measured
o Why? Because then you can look for patterns and relationships between these variables
o So each subject should have more variables
Motivation for conducting multivariate analysis:
• Measurement
• Explanation & Prediction
• Hypothesis Testing
The construct intelligence is a variable that is hard to measure. So you have multiple variables that
measure intelligence.
Basic concepts of multivariate analysis
• There are different measurement scales
o Nonmetric
o Metric
• Measurement and measurement error
• Statistical inference
• Types of techniques
Types of Data and Measurement Scales
• Nonmetric or qualitative
o Nominal = size of number is not related to
the amount of the characteristic being
measured
o Ordinal = larger numbers indicate more (or
less) of the characteristic being measured,
but not how much more (or less)
• Metric or quantitative
o Interval = contains ordinal properties, and in
addition, there are equal differences
between scale points
o Ratio = contains interval scale properties, and in addition, there is a natural zero point.
The level of measurement is critical in determining the appropriate multivariate technique to use.
2
,*Sometimes the data are stored as integers à this is a variable with values 1, 2, 3, 4, 5, but never 1.5
In a data table, usually=
• Row = subject
• Column = 1 variables
Measurement Error
• All variables have some error. When measuring something there is always some mistakes and errors.
• Measurement error = distorts observed relationships and makes multivariate techniques less
powerful.
• Researchers use summated scales, for which several variables are summed or averaged together to
form a composite representation of a concept
Because measurement errors distort
the results, we have to do something
about it.
The more error you have, the less
certainty you have about your
phenomena and relationships between
phenomena.
In statistics less chance t find an effect.
è Try to accommodate for this, by not relying on a single variable but to measure the same thing
several times and than create an average of it.
è Quantify the amount of error and correct them for the error you have. You can only do that when
you know how much error and the kind of error. In order to do this, distinguish two types of error=
o Random error
o Systematic error
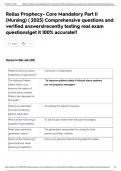
Measurement error consists of random error and systematic error.
• Random error = is a chance difference between the observed and
true values of something (e.g., a researcher misreading a weighing
scale records an incorrect measurement). = fuzzy error
• Systematic error = is a consistent or proportional difference
between the observed and true values of something (e.g., a
miscalibrated scale consistently registers weights as
higher than they actually are). Thus, there is systematic reason why
you measure the wrong thing, for example respondence
systematically under- or overrated.
By recognizing the sources of error, you can reduce their impacts and
record accurate and precise measurements.
àWe want to talk about reliable and valid measurement
3
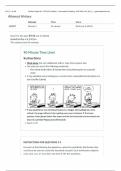
, In addressing measurement error, researchers evaluate two important characteristics of measurement:
• Reliability = the observed variable’s degree of precision (reproducibility of results) and thus the lack
of random measurement error.
• Validity = the degree to which a measure accurately represents what it is supposed to.
Statistical Significance and Power
Two types of errors can occur:
• Type I error, or α, is the probability of
rejecting the null hypothesis when it is
true.
o If the null hypothesis is true, but
we reject it.
• Type II error, or β, is the probability of
failing to reject the null hypothesis when it
is false.
o Although the effect is there, you fail to identify such, you have no sufficient evidence for
that.
• Power, or 1-β, is the probability of rejecting the null hypothesis when it is false.
Typical alpha α level = 5%. The significance level, also denoted as alpha or α, is the probability of
rejecting the null hypothesis when it is true. For example, a significance level of 0.05 indicates a 5% risk
of concluding that a difference exists when there is no actual difference.
Typical level of beta β risk = 20%. The probability of making a type II error (failing to reject the null
hypothesis when it is actually false).
The quantity (1 - β) is called power, the probability of observing an effect in the sample (if one), of a
specified effect size or greater exists in the population.
è The more stricter you are with alpha, the more leaner you have to be with Beta and the other way
around.
Er kunnen zich twee soorten fouten voordoen:
- Type I fout, of α, is de kans op verwerping van de nulhypothese wanneer deze waar is.
- Type II fout, of β, is de kans dat de nulhypothese niet wordt verworpen wanneer zij onjuist is.
- Power, of 1-β, is de kans dat de nulhypothese wordt verworpen wanneer deze onjuist is.
Statistical Significance and Power
• Effect size: the actual magnitude of the effect of interest (e.g., the difference between means or the
correlation between variables).
• Alpha (α): as α is set at smaller levels, power decreases. Typically, α = .05
• Sample size: as sample size increases, power increases. With very large sample sizes, even very
small effects can be statistically significant, raising the issue of practical significance vs. statistical
significance.
- Survey bias = systematic error is measurement error. Measurement error reduces the possibility
of finding an effect.
- The higher the measurement error the smaller the Beta.
4