Research Methods in Communication Science
1. Introduction to regression
2. Multiple regression
3. Mediation
4. Moderation
5. Repeated measures & Mixed-designs ANOVA
6. MANOVA
Hoorcollege 1: Introduction and Linear Regression (week 1)
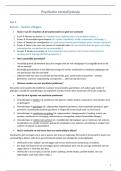
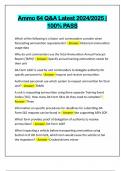
Slide: Scatter Plot
Ieder punt in het scatter plot geeft je de combinatie tussen het aantal jaren dat diegene
studeert (education) en het aantal canadian dollars (wages)
Slide: Simple Regression
Je gebruikt het scatter plot om een lijn te zijn (let us predict)
Een regressie is niets anders dan a line.
Het verschil tussen de Y en Y met dakje is Yi is wat reality is.
De relationship between wages and education is a line.
A line can be described by two numbers.
B0 is het laagste punt.
B1 is the slope. The slope is: the difference between the highest and lowest line (denk aan
taartpunt).
Regression is about telling which is the B0 and B1.
Presenting results of the regression. Everything is based on the B0 and B1.
The little i (for example Yi) in the formula stands for a person.
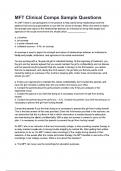
Slide: Regression results
Estimate stands for B (standard error)
Intercept is B0
Slide: Regression Interpretation
B1 is the most important thing in the output
,Slide: Regression results
T-test is significant
Slide: Standardized regression
Standardized regression: Take the variable, subtract the mean and devide by standard
defiation.
Why would you do that?
You do (standardize) that, because you want to which of the two variables have the
strongest effect of the wages (x is independent). If you want to compare it you need to
standardize the variables.
3.
Lineair relationship
We assume that the residuals mean 0 and they are not related to X. it means that the
assumption if we focus on
Slide: on residuals
Each person have a positive and negative residual. Each person has it’s own residual.
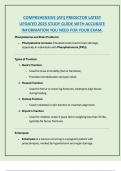
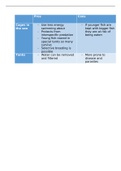
Slide: Splitting the Sum of Squares
Everyone get’s 16 Canadian dollars per hour, no matter what.
Error sum of squares is what is unexplained, what the regression does not explain.
How to calculate SST, SSR and SSE in R?
We often use three different sum of squares values to measure how well a regression line
actually fits a dataset:
1. Sum of Squares Total (SST) The sum of squared differences between individual data
points (yi) and the mean of the response variable (y_).
2. Sum of Squares Regression (SSR) The sum of squared differences between predicted
data points (y^i) and the mean of the response variable (y_).
3. Sum of Squares Error (SSE) The sum of squared differences between predicted data
points (y^i).
,We can verify that SST = SSR + SSE:
SST = SSR + SSE
1248.55 = 917.4751 + 331.0749
The metrics turn out to be:
Sum of Squares Total (SST): 1248.55
Sum of Squares Regression (SSR): 917.4751
Sum of Squares error (SSE): 331.0749
We can also manually calculate the R-squared of the regression model:
R-squared = SSR / SST (ranges from 0 to 1)
R-squared = 917..55
R-squared = 0.7348
This tells us that 73.48% of the variation in exam scores can be explained by the number of
hours studied.
Je krijgt nooit een getal in de min (dan heb je het sowieso fout!), dit getal is namelijk nooit
negatief.
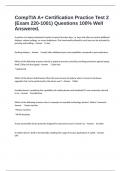
What is a lineair model?
The x-as (horizontale as) are the independent variables
The y-as (vertical as) are the dependent variables
The value of the y depends on the value of the x.
, For example the value of the distance that a car have to take to stop depends
on the speed of the car.
We can predict what value of y we expect for a given value of x.
In this example: How much distance is the car requite to stop given the
particular speed of the car?
We can take any value for x and we can predict any value for y (this is not 100%
accurate).
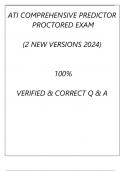
What is Y intercept?
In this example -17.5
What is the slope?
For every one mile per hour the speed to stop the car will be 3.9 in this
example.
If you have the y intercept and the slope you can draw the line in the model.
What is the p value?
What is R2?
The proportion of the variation in y as that can be explained by the x as. In this
example 0.65 so we can say 65% of the variation in the distance taken to stop
can be explained by the changes in the speed of the car.
In the program R
Dependent variable(s) first, then the independent variable(s).
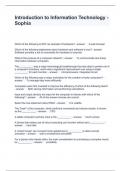
What are the residuals?
A good model is when the dots fits near or on the blue line. A bad model is
when the dots are everywhere in the model.
Interquartel range is around 0.
1Q is the lowest value
Median is the average value
3Q is the highest value
The intercept is -17.5791. but you can’t have -17.5791 meters. But you need it
to create the model.
1. Introduction to regression
2. Multiple regression
3. Mediation
4. Moderation
5. Repeated measures & Mixed-designs ANOVA
6. MANOVA
Hoorcollege 1: Introduction and Linear Regression (week 1)
Slide: Scatter Plot
Ieder punt in het scatter plot geeft je de combinatie tussen het aantal jaren dat diegene
studeert (education) en het aantal canadian dollars (wages)
Slide: Simple Regression
Je gebruikt het scatter plot om een lijn te zijn (let us predict)
Een regressie is niets anders dan a line.
Het verschil tussen de Y en Y met dakje is Yi is wat reality is.
De relationship between wages and education is a line.
A line can be described by two numbers.
B0 is het laagste punt.
B1 is the slope. The slope is: the difference between the highest and lowest line (denk aan
taartpunt).
Regression is about telling which is the B0 and B1.
Presenting results of the regression. Everything is based on the B0 and B1.
The little i (for example Yi) in the formula stands for a person.
Slide: Regression results
Estimate stands for B (standard error)
Intercept is B0
Slide: Regression Interpretation
B1 is the most important thing in the output
,Slide: Regression results
T-test is significant
Slide: Standardized regression
Standardized regression: Take the variable, subtract the mean and devide by standard
defiation.
Why would you do that?
You do (standardize) that, because you want to which of the two variables have the
strongest effect of the wages (x is independent). If you want to compare it you need to
standardize the variables.
3.
Lineair relationship
We assume that the residuals mean 0 and they are not related to X. it means that the
assumption if we focus on
Slide: on residuals
Each person have a positive and negative residual. Each person has it’s own residual.
Slide: Splitting the Sum of Squares
Everyone get’s 16 Canadian dollars per hour, no matter what.
Error sum of squares is what is unexplained, what the regression does not explain.
How to calculate SST, SSR and SSE in R?
We often use three different sum of squares values to measure how well a regression line
actually fits a dataset:
1. Sum of Squares Total (SST) The sum of squared differences between individual data
points (yi) and the mean of the response variable (y_).
2. Sum of Squares Regression (SSR) The sum of squared differences between predicted
data points (y^i) and the mean of the response variable (y_).
3. Sum of Squares Error (SSE) The sum of squared differences between predicted data
points (y^i).
,We can verify that SST = SSR + SSE:
SST = SSR + SSE
1248.55 = 917.4751 + 331.0749
The metrics turn out to be:
Sum of Squares Total (SST): 1248.55
Sum of Squares Regression (SSR): 917.4751
Sum of Squares error (SSE): 331.0749
We can also manually calculate the R-squared of the regression model:
R-squared = SSR / SST (ranges from 0 to 1)
R-squared = 917..55
R-squared = 0.7348
This tells us that 73.48% of the variation in exam scores can be explained by the number of
hours studied.
Je krijgt nooit een getal in de min (dan heb je het sowieso fout!), dit getal is namelijk nooit
negatief.
What is a lineair model?
The x-as (horizontale as) are the independent variables
The y-as (vertical as) are the dependent variables
The value of the y depends on the value of the x.
, For example the value of the distance that a car have to take to stop depends
on the speed of the car.
We can predict what value of y we expect for a given value of x.
In this example: How much distance is the car requite to stop given the
particular speed of the car?
We can take any value for x and we can predict any value for y (this is not 100%
accurate).
What is Y intercept?
In this example -17.5
What is the slope?
For every one mile per hour the speed to stop the car will be 3.9 in this
example.
If you have the y intercept and the slope you can draw the line in the model.
What is the p value?
What is R2?
The proportion of the variation in y as that can be explained by the x as. In this
example 0.65 so we can say 65% of the variation in the distance taken to stop
can be explained by the changes in the speed of the car.
In the program R
Dependent variable(s) first, then the independent variable(s).
What are the residuals?
A good model is when the dots fits near or on the blue line. A bad model is
when the dots are everywhere in the model.
Interquartel range is around 0.
1Q is the lowest value
Median is the average value
3Q is the highest value
The intercept is -17.5791. but you can’t have -17.5791 meters. But you need it
to create the model.