Studying systems of enzymes exercises 5 and 6
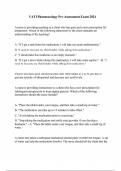
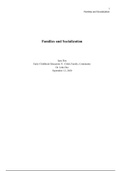
5a. a steady state of approx. 3 is observed from the upper graph 1. If we take a look at the dynamic
graph, the level is around the same as the final concentration (equal) so 3.065
5b. The blue curve shows it from the static graph.
5c. Around 10 minutes to reach the steady state
5d. 2.149
( 2.149−2.145 ) x 100
5e. Decreasing E1 1% 2.145 =0.18 % this is the percentage decrease for E1
2.149
Decreasing E2 1% 2.132
0.18
=0.18(control coefficient).
0.79 1
2.149−2.132¿ x 100 ¿ =0.79 → =0.79(control coefficient ) percentage decrease for
2.149 1
E2.
5f. the sum of the control coefficients is around 1. The control coefficients tells us by which amount
the rate of the steady state decreases when an enzyme decreases. If the control coefficient equals 0.7
then a 1% decrease in this enzyme 0.7% decrease in the pathway.
5g. None, there is not an enzyme that really limits the rate in this case because rate limitation is
distributed.
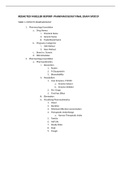
5h. The change in the Hill coefficient changes the steepness of the feedback inhibition P on E1 (it has
increased).
6a. The Hill constant of the glycogen synthesis determines the steepness in this case, so if we for
example increase the demand and thereby the vmax from 2 5, this will lead to a decrease in the
blood glucose level (<3) and thereby when we choose a hill constant of 1 this will lead to a decrease of
3 4.5 becomes 1.5
6b. The glycogen synthesis process is regulated by insulin in this model. By lowering the Vmax or by
changing the value to a higher state of the half-activation concentration by glucose, we can stimulate
the hyperglycaemia. Thereby we stimulate the a decrease/lack of this stimulation by a high blood
glucose level. When the lower the Vmax, we could forcefully stimulate the glycogen synthesis due to
the fact that we change the half-activation concentration by glucose to a much lower value, thereby
over-stimulating this process.
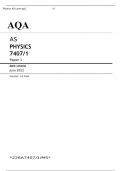
6c. The difference is that the dynamic state will never reach a steady state.
6d. 1. Blood glucose inhibition in the glucose uptake process
2. when the glucose uptake is not higher than the glucose demand.
5a. a steady state of approx. 3 is observed from the upper graph 1. If we take a look at the dynamic
graph, the level is around the same as the final concentration (equal) so 3.065
5b. The blue curve shows it from the static graph.
5c. Around 10 minutes to reach the steady state
5d. 2.149
( 2.149−2.145 ) x 100
5e. Decreasing E1 1% 2.145 =0.18 % this is the percentage decrease for E1
2.149
Decreasing E2 1% 2.132
0.18
=0.18(control coefficient).
0.79 1
2.149−2.132¿ x 100 ¿ =0.79 → =0.79(control coefficient ) percentage decrease for
2.149 1
E2.
5f. the sum of the control coefficients is around 1. The control coefficients tells us by which amount
the rate of the steady state decreases when an enzyme decreases. If the control coefficient equals 0.7
then a 1% decrease in this enzyme 0.7% decrease in the pathway.
5g. None, there is not an enzyme that really limits the rate in this case because rate limitation is
distributed.
5h. The change in the Hill coefficient changes the steepness of the feedback inhibition P on E1 (it has
increased).
6a. The Hill constant of the glycogen synthesis determines the steepness in this case, so if we for
example increase the demand and thereby the vmax from 2 5, this will lead to a decrease in the
blood glucose level (<3) and thereby when we choose a hill constant of 1 this will lead to a decrease of
3 4.5 becomes 1.5
6b. The glycogen synthesis process is regulated by insulin in this model. By lowering the Vmax or by
changing the value to a higher state of the half-activation concentration by glucose, we can stimulate
the hyperglycaemia. Thereby we stimulate the a decrease/lack of this stimulation by a high blood
glucose level. When the lower the Vmax, we could forcefully stimulate the glycogen synthesis due to
the fact that we change the half-activation concentration by glucose to a much lower value, thereby
over-stimulating this process.
6c. The difference is that the dynamic state will never reach a steady state.
6d. 1. Blood glucose inhibition in the glucose uptake process
2. when the glucose uptake is not higher than the glucose demand.