Data Science for Business Summary
What You Need to Know About Data Mining and Data-Analytic Thinking
Foster Provost & Tom Fawcett
Author: Martijn C. Paulussen
University: Maastricht University School of Business and Economics
Master: MSc Business Intelligence & Smart Services
Course: [EBC4220] Business Analytics
School of Business and Economics
MSc Business Intelligence & Smart Services
© 2017 Martijn Paulussen - Maastricht University School of Business and Economics
Nothing in this publication may be reproduced and/or made public by means of printing, offset, photocopy or
microfilm or in any digital, electronic, optical or any other form without the prior written permission of the
owner of the copyright.
,Table of Contents
Chapter 0 - Introduction and general insights ................................................................................................3
Chapter 1 - Data Analytic Thinking ...............................................................................................................3
1.1. Data Driven Decision making (DDD) .................................................................................................3
Chapter 2 –Data Mining Tasks and Business Problems .................................................................................4
2.1. Supervised vs Unsupervised ................................................................................................................5
2.2. Data mining and KDD .........................................................................................................................5
Chapter 3 - Predictive Modeling: Correlation to Supervised Segmentation ..................................................6
3.1. Entropy ................................................................................................................................................6
3.2. Information Gain .................................................................................................................................8
3.3. Entropy Chart ......................................................................................................................................9
3.4. Supervised Segmentation with Tree-Structured Models .....................................................................9
Chapter 4 - Fitting a Model to Data..............................................................................................................11
4.1. Support Vector Machines ..................................................................................................................11
4.2. Logistic Regression ...........................................................................................................................12
Chapter 5 - Overfitting and its Avoidance....................................................................................................13
5.1. Holdout Data .....................................................................................................................................13
5.2. Cross-validation.................................................................................................................................14
5.3. Learning Curve ..................................................................................................................................14
Chapter 6 - Similarity, Neighbors, and Clusters ...........................................................................................15
6.1. General Euclidean Distance ..............................................................................................................15
6.2. Nearest Neighbor ...............................................................................................................................15
6.3. Clustering ..........................................................................................................................................17
6.4. Centroids Clustering ..........................................................................................................................17
Chapter 7 - Decision Analytic Thinking 1: What is a Good Model? ...........................................................19
7.1. Confusion Matrix...............................................................................................................................19
7.2. Expected Value (Profit) .....................................................................................................................19
7.3. Sensitivity, Specificity and Accuracy................................................................................................21
7.4. Baseline Methods ..............................................................................................................................21
Chapter 8 - Visualizing Model Performance ................................................................................................22
8.1. Profit Curve .......................................................................................................................................22
8.2. ROC graphs and curves .....................................................................................................................23
8.2.1. Area Under the ROC Curve (AUC) ...........................................................................................23
8.3. Cumulative response curves ..............................................................................................................24
8.4. Lift curves..........................................................................................................................................24
8.5. Example: Performance Analytics for Churn Modeling .....................................................................24
8.5.1. Fitting Curve ...............................................................................................................................24
Chapter 9 - Evidence and Probabilities ........................................................................................................25
1
, 9.1. Joint Probabilities and Independence ................................................................................................25
9.2. Naïve Bayes .......................................................................................................................................25
9.3. Evidence Lift .....................................................................................................................................26
Chapter 11 - Decision Analytics Thinking 2: Toward Analytical Engineering ...........................................27
11.1. Expected Value................................................................................................................................27
Chapter 13 - Data Science and Business Strategy ........................................................................................28
Chapter Extra: Fuzzy Systems ......................................................................................................................29
Crisp sets ..................................................................................................................................................29
Fuzzy sets .................................................................................................................................................29
Chapter Extra: Neural Networks ..................................................................................................................32
Chapter Extra: Formula Sheet ......................................................................................................................34
Chapter Exam Question................................................................................................................................35
2
,Chapter 0 - Introduction and general insights
Big Data: Datasets that are too large for traditional data processing systems.
Web 2.0: where new systems and companies began taking advantage of the interactive nature of the Web.
Chapter 1 - Data Analytic Thinking
1.1. Data Driven Decision making (DDD)
Data science involves principles, processes, and techniques for
understanding phenomena via the (automated) analysis of data in
order to improve decision making.
Data-driven decision-making [DDD] refers to the practice of basing
decisions on the analysis of data, rather than purely on intuition.
Two decision types: (1) decisions for which “discoveries” need to be
made within data, and (2) decisions that repeat, especially at massive
scale, and so decision-making can benefit from even small increases in
decision-making accuracy based on data analysis.
Fundamental concept 1: Extracting useful knowledge from data to
solve business problems can be treated systematically by following a
process with reasonably well-defined stages. (e.g. CRISP-DM)
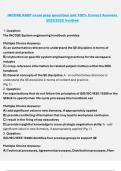
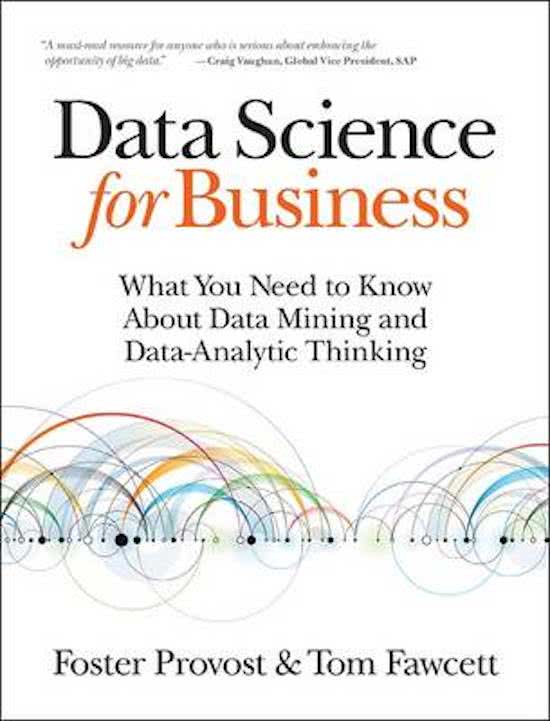
Fundamental concept 2: From a large mass of data, information
technology can be used to find informative descriptive attributes of Figure 1-1. Data science in the
entities of interest. context of various data-related
processes in the organization.
Fundamental concept 3: If you look too hard at a set of data, you
will find something—but it might not generalize beyond the data you’re looking at.
Fundamental concept 4: Formulating data mining solutions and evaluating the results involves thinking
carefully about the context in which they will be used.
3
, Chapter 2 –Data Mining Tasks and Business Problems
Fundamental concepts: A set of canonical data mining tasks; The data mining process; Supervised
versus unsupervised data mining.
1. Classification & Probability estimation: Predict, for each individual in a population, which of a
(small) set of classes this individual belongs to. (Will it happen?)
Q: Among all the customers of TelCo, which are likely to respond to a given offer?
A: e.g. two classes: will respond and will not respond. Yes or No.
Class probability estimation: a score representing the probability (or some other quantification of
likelihood) that that individual belongs to each class.
2. Regression (value estimation): Estimate or predict, for each individual, the numerical value of some
variable for that individual. (How much?)
Q: How much will a given customer use the service?
A: predict service usage (target). Model can be based on other similar individuals (variables).
3. Similarity matching: Identify similar individuals based on data known about them.
Similarity matching can be used directly to find similar entities.
4. Clustering: to group individuals in a population together by their similarity, but not driven by any
specific purpose. (Chapter 6)
Q: Do our customers form natural groups or segments? What products should we offer or
develop? How should our customer care teams (or sales teams) be structured?
Clustering is useful in preliminary domain exploration to see which natural groups exist
5. Co-occurrence grouping: Find associations between entities based on transactions involving them.
Q: What items are commonly purchased together?
While clustering looks at similarity between objects based on the objects’ attributes, co-occurrence
grouping considers similarity of objects based on their appearing together in transactions. “People
who bought X also bought Y”
6. Profiling: attempts to characterize the typical behavior of an individual, group, or population.
Q: What is the typical cell phone usage (day, night, international) of this customer segment?
Profiling is often used to establish behavioral norms for anomaly detection applications such as
fraud detection and monitoring for intrusions to computer systems
7. Link prediction: Predict connections between data items, usually by suggesting that a link should
exist, and possibly also estimating the strength of the link.
Q: Since you and Karen share 10 friends, maybe you’d like to be Karen’s friend?
Link prediction can also estimate the strength of a link. We search for links that do not exist
between customers and movies, but that we predict should exist and should be strong.
8. Data reduction: Take a large set of data and replace it with a smaller set of data that contains much of
the important information in the larger set.
Data reduction usually involves loss of information. What is important is the trade-off for
improved insight.
9. Causal modeling: Helps us understand what events or actions actually influence others.
4
What You Need to Know About Data Mining and Data-Analytic Thinking
Foster Provost & Tom Fawcett
Author: Martijn C. Paulussen
University: Maastricht University School of Business and Economics
Master: MSc Business Intelligence & Smart Services
Course: [EBC4220] Business Analytics
School of Business and Economics
MSc Business Intelligence & Smart Services
© 2017 Martijn Paulussen - Maastricht University School of Business and Economics
Nothing in this publication may be reproduced and/or made public by means of printing, offset, photocopy or
microfilm or in any digital, electronic, optical or any other form without the prior written permission of the
owner of the copyright.
,Table of Contents
Chapter 0 - Introduction and general insights ................................................................................................3
Chapter 1 - Data Analytic Thinking ...............................................................................................................3
1.1. Data Driven Decision making (DDD) .................................................................................................3
Chapter 2 –Data Mining Tasks and Business Problems .................................................................................4
2.1. Supervised vs Unsupervised ................................................................................................................5
2.2. Data mining and KDD .........................................................................................................................5
Chapter 3 - Predictive Modeling: Correlation to Supervised Segmentation ..................................................6
3.1. Entropy ................................................................................................................................................6
3.2. Information Gain .................................................................................................................................8
3.3. Entropy Chart ......................................................................................................................................9
3.4. Supervised Segmentation with Tree-Structured Models .....................................................................9
Chapter 4 - Fitting a Model to Data..............................................................................................................11
4.1. Support Vector Machines ..................................................................................................................11
4.2. Logistic Regression ...........................................................................................................................12
Chapter 5 - Overfitting and its Avoidance....................................................................................................13
5.1. Holdout Data .....................................................................................................................................13
5.2. Cross-validation.................................................................................................................................14
5.3. Learning Curve ..................................................................................................................................14
Chapter 6 - Similarity, Neighbors, and Clusters ...........................................................................................15
6.1. General Euclidean Distance ..............................................................................................................15
6.2. Nearest Neighbor ...............................................................................................................................15
6.3. Clustering ..........................................................................................................................................17
6.4. Centroids Clustering ..........................................................................................................................17
Chapter 7 - Decision Analytic Thinking 1: What is a Good Model? ...........................................................19
7.1. Confusion Matrix...............................................................................................................................19
7.2. Expected Value (Profit) .....................................................................................................................19
7.3. Sensitivity, Specificity and Accuracy................................................................................................21
7.4. Baseline Methods ..............................................................................................................................21
Chapter 8 - Visualizing Model Performance ................................................................................................22
8.1. Profit Curve .......................................................................................................................................22
8.2. ROC graphs and curves .....................................................................................................................23
8.2.1. Area Under the ROC Curve (AUC) ...........................................................................................23
8.3. Cumulative response curves ..............................................................................................................24
8.4. Lift curves..........................................................................................................................................24
8.5. Example: Performance Analytics for Churn Modeling .....................................................................24
8.5.1. Fitting Curve ...............................................................................................................................24
Chapter 9 - Evidence and Probabilities ........................................................................................................25
1
, 9.1. Joint Probabilities and Independence ................................................................................................25
9.2. Naïve Bayes .......................................................................................................................................25
9.3. Evidence Lift .....................................................................................................................................26
Chapter 11 - Decision Analytics Thinking 2: Toward Analytical Engineering ...........................................27
11.1. Expected Value................................................................................................................................27
Chapter 13 - Data Science and Business Strategy ........................................................................................28
Chapter Extra: Fuzzy Systems ......................................................................................................................29
Crisp sets ..................................................................................................................................................29
Fuzzy sets .................................................................................................................................................29
Chapter Extra: Neural Networks ..................................................................................................................32
Chapter Extra: Formula Sheet ......................................................................................................................34
Chapter Exam Question................................................................................................................................35
2
,Chapter 0 - Introduction and general insights
Big Data: Datasets that are too large for traditional data processing systems.
Web 2.0: where new systems and companies began taking advantage of the interactive nature of the Web.
Chapter 1 - Data Analytic Thinking
1.1. Data Driven Decision making (DDD)
Data science involves principles, processes, and techniques for
understanding phenomena via the (automated) analysis of data in
order to improve decision making.
Data-driven decision-making [DDD] refers to the practice of basing
decisions on the analysis of data, rather than purely on intuition.
Two decision types: (1) decisions for which “discoveries” need to be
made within data, and (2) decisions that repeat, especially at massive
scale, and so decision-making can benefit from even small increases in
decision-making accuracy based on data analysis.
Fundamental concept 1: Extracting useful knowledge from data to
solve business problems can be treated systematically by following a
process with reasonably well-defined stages. (e.g. CRISP-DM)
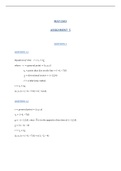
Fundamental concept 2: From a large mass of data, information
technology can be used to find informative descriptive attributes of Figure 1-1. Data science in the
entities of interest. context of various data-related
processes in the organization.
Fundamental concept 3: If you look too hard at a set of data, you
will find something—but it might not generalize beyond the data you’re looking at.
Fundamental concept 4: Formulating data mining solutions and evaluating the results involves thinking
carefully about the context in which they will be used.
3
, Chapter 2 –Data Mining Tasks and Business Problems
Fundamental concepts: A set of canonical data mining tasks; The data mining process; Supervised
versus unsupervised data mining.
1. Classification & Probability estimation: Predict, for each individual in a population, which of a
(small) set of classes this individual belongs to. (Will it happen?)
Q: Among all the customers of TelCo, which are likely to respond to a given offer?
A: e.g. two classes: will respond and will not respond. Yes or No.
Class probability estimation: a score representing the probability (or some other quantification of
likelihood) that that individual belongs to each class.
2. Regression (value estimation): Estimate or predict, for each individual, the numerical value of some
variable for that individual. (How much?)
Q: How much will a given customer use the service?
A: predict service usage (target). Model can be based on other similar individuals (variables).
3. Similarity matching: Identify similar individuals based on data known about them.
Similarity matching can be used directly to find similar entities.
4. Clustering: to group individuals in a population together by their similarity, but not driven by any
specific purpose. (Chapter 6)
Q: Do our customers form natural groups or segments? What products should we offer or
develop? How should our customer care teams (or sales teams) be structured?
Clustering is useful in preliminary domain exploration to see which natural groups exist
5. Co-occurrence grouping: Find associations between entities based on transactions involving them.
Q: What items are commonly purchased together?
While clustering looks at similarity between objects based on the objects’ attributes, co-occurrence
grouping considers similarity of objects based on their appearing together in transactions. “People
who bought X also bought Y”
6. Profiling: attempts to characterize the typical behavior of an individual, group, or population.
Q: What is the typical cell phone usage (day, night, international) of this customer segment?
Profiling is often used to establish behavioral norms for anomaly detection applications such as
fraud detection and monitoring for intrusions to computer systems
7. Link prediction: Predict connections between data items, usually by suggesting that a link should
exist, and possibly also estimating the strength of the link.
Q: Since you and Karen share 10 friends, maybe you’d like to be Karen’s friend?
Link prediction can also estimate the strength of a link. We search for links that do not exist
between customers and movies, but that we predict should exist and should be strong.
8. Data reduction: Take a large set of data and replace it with a smaller set of data that contains much of
the important information in the larger set.
Data reduction usually involves loss of information. What is important is the trade-off for
improved insight.
9. Causal modeling: Helps us understand what events or actions actually influence others.
4