Statistics Exam Notes
CHAPTER 1 - looking at Data Distributions
Terms:
- cases: objects described by a set of data → usually people in global health, could also
be villages, tractors etc.
- variable: a characteristic of a case → e.g. height
- value: different cases have different values of a variable → the height in cm
- label (unique ID): used to distinguish or uniquely identify cases with the dataset →
e.g. gender
- the key characteristics of a data set answer the questions: who, what and why?
Examining distributions:
- overall pattern:
● shape: e.g. normally distributed
● center
● spread
- deviations
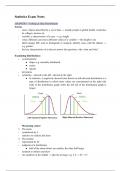
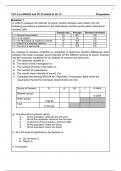
- symmetry - skewed to the left / skewed to the right
● In statistics, a negatively skewed (also known as left-skewed) distribution is a
type of distribution in which more values are concentrated on the right side
(tail) of the distribution graph while the left tail of the distribution graph is
longer.
Measuring center:
1. The mean
- symbolized by x̄
- sensitive to outliers and skew
2. The median
- represented by M
- midpoint of a distribution
● half of the observations are smaller, the other half larger
- resistant to outliers and skew
- two numbers in the middle → take the average: e.g. 3,4 → M = 3.5
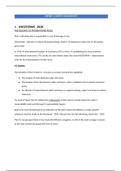
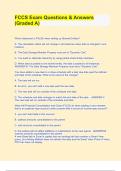
,Measuring spread: the quartiles
● works with the median (not the mean)
● splitting data into quartiles means splitting into 4 parts
● the median split the data into 2
● IQR (interquartile range)= Q3-Q1
● 1.5 x IQR rule for identifying outliers → anything greater than Q3 (or smaller than
Q1) + outcome of (1.5xIQR) is an outlier
- Multiplying the interquartile range (IQR) by 1.5 will give us a way to
determine whether a certain value is an outlier. If we subtract 1.5 x IQR from
the first quartile, any data values that are less than this number are considered
outliers.
● Order: minimum - quartile 1 - median/quartile 2 - quartile 3 - maximum
Boxplots
Measuring spread: the standard deviation
- works with the mean (not the median)
- symbolized by Sx
- average distance of the observations from the mean
1
,Choosing measures of center and spread:
NOTE: The median and IQR are usually better than the mean and standard deviation for
describing a skewed distribution or a distribution with outliers.
→ use mean and standard deviation only for reasonably symmetric distributions that
do not have outliers
Models
A model: a simplified representation of something more complex that helps us to understand
something
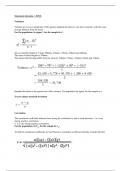
1. density curve:
- smooth curve drawn over the distribution
- it is a model of the distribution
- it is a model of what value the variable takes and how often
- if a smooth curve is always above the x-axis and the total mass/area/volume
under the curve is scaled to 1, it is a density curve
2
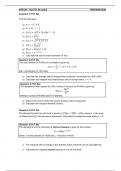
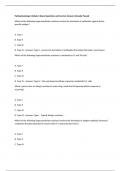
, Area under the curve:
● total area under a density curve is 1
● EXAMPLE: proportion of the density curve that is shaded (from 6 and <) is equal to
0.293 in a model showing the vocabulary score of 947 seventh graders → how to
interpret? About 29.3% of the vocabulary scores of the 947 seventh graders is below a
6.
Greek letters
● When mean and standard deviation come from a model of the data, Greek letters are
used:
Normal density curve:
- mathematical model for normally distributed data
- symmetric, single-peaked, and bell-shaped
- completely described by two numbers: u (mean) and 𝜎 (standard deviation)
- N (u,𝜎)
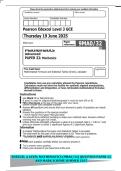
The 68-95-99.7 rule
In the Normal distribution with mean u and standard deviation 𝜎:
- approximately 68% of the observations fall within 1𝜎 of u
- approximately 95% of the observations fall within 2𝜎 of u
- approximately 99.7% of the observation fall within 3𝜎 of u
Standard normal distribution
● N (0,1)
● Simply easier to work with
● All normal distributions can be transformed (standardized) to N (0,1) (mean, SD))
--> standard normal probability/ standardized value of x/ z-score
3
CHAPTER 1 - looking at Data Distributions
Terms:
- cases: objects described by a set of data → usually people in global health, could also
be villages, tractors etc.
- variable: a characteristic of a case → e.g. height
- value: different cases have different values of a variable → the height in cm
- label (unique ID): used to distinguish or uniquely identify cases with the dataset →
e.g. gender
- the key characteristics of a data set answer the questions: who, what and why?
Examining distributions:
- overall pattern:
● shape: e.g. normally distributed
● center
● spread
- deviations
- symmetry - skewed to the left / skewed to the right
● In statistics, a negatively skewed (also known as left-skewed) distribution is a
type of distribution in which more values are concentrated on the right side
(tail) of the distribution graph while the left tail of the distribution graph is
longer.
Measuring center:
1. The mean
- symbolized by x̄
- sensitive to outliers and skew
2. The median
- represented by M
- midpoint of a distribution
● half of the observations are smaller, the other half larger
- resistant to outliers and skew
- two numbers in the middle → take the average: e.g. 3,4 → M = 3.5
,Measuring spread: the quartiles
● works with the median (not the mean)
● splitting data into quartiles means splitting into 4 parts
● the median split the data into 2
● IQR (interquartile range)= Q3-Q1
● 1.5 x IQR rule for identifying outliers → anything greater than Q3 (or smaller than
Q1) + outcome of (1.5xIQR) is an outlier
- Multiplying the interquartile range (IQR) by 1.5 will give us a way to
determine whether a certain value is an outlier. If we subtract 1.5 x IQR from
the first quartile, any data values that are less than this number are considered
outliers.
● Order: minimum - quartile 1 - median/quartile 2 - quartile 3 - maximum
Boxplots
Measuring spread: the standard deviation
- works with the mean (not the median)
- symbolized by Sx
- average distance of the observations from the mean
1
,Choosing measures of center and spread:
NOTE: The median and IQR are usually better than the mean and standard deviation for
describing a skewed distribution or a distribution with outliers.
→ use mean and standard deviation only for reasonably symmetric distributions that
do not have outliers
Models
A model: a simplified representation of something more complex that helps us to understand
something
1. density curve:
- smooth curve drawn over the distribution
- it is a model of the distribution
- it is a model of what value the variable takes and how often
- if a smooth curve is always above the x-axis and the total mass/area/volume
under the curve is scaled to 1, it is a density curve
2
, Area under the curve:
● total area under a density curve is 1
● EXAMPLE: proportion of the density curve that is shaded (from 6 and <) is equal to
0.293 in a model showing the vocabulary score of 947 seventh graders → how to
interpret? About 29.3% of the vocabulary scores of the 947 seventh graders is below a
6.
Greek letters
● When mean and standard deviation come from a model of the data, Greek letters are
used:
Normal density curve:
- mathematical model for normally distributed data
- symmetric, single-peaked, and bell-shaped
- completely described by two numbers: u (mean) and 𝜎 (standard deviation)
- N (u,𝜎)
The 68-95-99.7 rule
In the Normal distribution with mean u and standard deviation 𝜎:
- approximately 68% of the observations fall within 1𝜎 of u
- approximately 95% of the observations fall within 2𝜎 of u
- approximately 99.7% of the observation fall within 3𝜎 of u
Standard normal distribution
● N (0,1)
● Simply easier to work with
● All normal distributions can be transformed (standardized) to N (0,1) (mean, SD))
--> standard normal probability/ standardized value of x/ z-score
3