What does a Normal Distribution look like?
The Normal Distribution is one kind of probability distribution that is commonly used in the study of
Psychological phenomena. Because the Normal Distribution is a type of probability distribution, it
depicts the distribution of a variable at the population level, displaying the probability associated
with all possible outcomes.
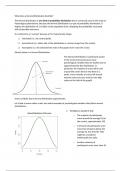
It is referred to as “normal” because of it’s characteristic shape:
1. Unimodal (i.e. one central peak)
2. Symmetrical (i.e. either side of the distribution is a mirror image from the center)
3. Asymptotic (i.e. the tails/extreme ends of the graph never reach the x-axis)
Directly below is a Normal Distribution.
The Normal Distribution is particularly useful
in the social sciences because many
psychological variables that are studied can be
approximated by this distribution. In
particular, the majority of scores fall in and
around the centre (hence why there is a
peak), and a minority of scores fall around
extreme values (at very small or very high
values at the tails of the graph)
Some variables that a Normal Distribution approximates
Let’s look at some rather crude, but useful examples of psychological variables that follow normal
distributions:
1. Intelligence quotients (IQ)
o The majority of participants
score around the average IQ (at
the centre), approximately 100
o A minority of participants score
more than 20 points below the
average IQ, less than 80. They
might be considered
intellectually less able.
o Another minority of
participants score more than 20
, points above the average IQ, greater than 120. They might be considered more
intelligent than average.
2. Working memory (Digit Span Test)
o The majority of people can typically
remember 5 to 8 numbers
o A minority of people can only
remember fewer than 5 numbers.
They might be considered to be
impaired in memory.
o Another minority of participants can
remember more than 8 numbers.
They might be considered to have
above average memory abilities.
Normal vs Other Distributions
The Normal Distribution is a just one type of probability distribution. Each probability distribtuions
has its own associated characteristics.
All distributions can be described in terms of their symmetry and kurtosis
1.3.1 Symmetry
Normal Distributions are symmetrical, but for asymmetrical distributions, they can be characterised
as
1. Positively skewed
Most of the values are clustered together at the left-hand side of the distribution, with
a longer right-hand tail
2. Negatively skewed
Most of the values are clustered together at the right-hand side of the distribution, with
a longer left-hand tail
The Normal Distribution is one kind of probability distribution that is commonly used in the study of
Psychological phenomena. Because the Normal Distribution is a type of probability distribution, it
depicts the distribution of a variable at the population level, displaying the probability associated
with all possible outcomes.
It is referred to as “normal” because of it’s characteristic shape:
1. Unimodal (i.e. one central peak)
2. Symmetrical (i.e. either side of the distribution is a mirror image from the center)
3. Asymptotic (i.e. the tails/extreme ends of the graph never reach the x-axis)
Directly below is a Normal Distribution.
The Normal Distribution is particularly useful
in the social sciences because many
psychological variables that are studied can be
approximated by this distribution. In
particular, the majority of scores fall in and
around the centre (hence why there is a
peak), and a minority of scores fall around
extreme values (at very small or very high
values at the tails of the graph)
Some variables that a Normal Distribution approximates
Let’s look at some rather crude, but useful examples of psychological variables that follow normal
distributions:
1. Intelligence quotients (IQ)
o The majority of participants
score around the average IQ (at
the centre), approximately 100
o A minority of participants score
more than 20 points below the
average IQ, less than 80. They
might be considered
intellectually less able.
o Another minority of
participants score more than 20
, points above the average IQ, greater than 120. They might be considered more
intelligent than average.
2. Working memory (Digit Span Test)
o The majority of people can typically
remember 5 to 8 numbers
o A minority of people can only
remember fewer than 5 numbers.
They might be considered to be
impaired in memory.
o Another minority of participants can
remember more than 8 numbers.
They might be considered to have
above average memory abilities.
Normal vs Other Distributions
The Normal Distribution is a just one type of probability distribution. Each probability distribtuions
has its own associated characteristics.
All distributions can be described in terms of their symmetry and kurtosis
1.3.1 Symmetry
Normal Distributions are symmetrical, but for asymmetrical distributions, they can be characterised
as
1. Positively skewed
Most of the values are clustered together at the left-hand side of the distribution, with
a longer right-hand tail
2. Negatively skewed
Most of the values are clustered together at the right-hand side of the distribution, with
a longer left-hand tail