QUESTION 1
1.1 Panel data, also known as longitudinal data, is a type of data that contains
observations of the same units or individuals over a period of time. Researchers use
panel data because it allows them to control for unobserved heterogeneity and to
estimate the effects of variables that do not vary over time. Panel data can also
increase the efficiency of the estimation, as it provides more information than a single
cross-sectional or time-series data set.
In South Africa, panel data has been used in various fields such as economics, health,
and education to study the impact of policies and programs. For example, researchers
have used panel data to examine the effects of affirmative action policies on
employment outcomes, the impact of HIV/AIDS intervention programs on health
outcomes, and the effectiveness of educational interventions on academic performance.
1.2 Random effects and pooled OLS are two popular methods to estimate panel data
models. Random effects are preferred over pooled OLS for several reasons. Firstly,
random effects allow for the presence of unobserved time-invariant heterogeneity
across individuals, which can bias the estimates in pooled OLS. Secondly, random
effects can account for the correlation between the individual-specific effects and the
regressors, which can also bias the estimates in pooled OLS. Finally, random effects
can be more efficient than pooled OLS, especially when the number of individuals is
large relative to the number of time periods.
1.3 To determine which model is better between pooled OLS and least square dummy
variable, researchers can use several methods. Firstly, they can compare the R-
squared and adjusted R-squared of both models, where a higher value indicates a
better fit. Secondly, they can perform a Hausman test, which tests whether the random
effects assumption of the least square dummy variable model is valid. If the test rejects
the null hypothesis of no difference between the two models, then random effects
should be preferred. Thirdly, they can compare the Akaike information criterion (AIC)
and the Bayesian information criterion (BIC) of both models, where a lower value
indicates a better fit. Finally, they can assess the robustness of the results to alternative
specifications and assumptions.
, QUESTION 2
2.1 The a-priori expected relationship between wages and employment is not
straightforward and can vary depending on factors such as the level of economic
development, labor market regulations, and the nature of the industry. In general,
however, there is a negative relationship between wages and employment, as higher
wages may lead to lower demand for labor and higher unemployment rates. This
relationship is known as the "wage-unemployment" curve or the "Phillips curve". The
Phillips curve was first introduced by economist A.W. Phillips in the 1950s, who found
an inverse relationship between wage inflation and unemployment in the UK economy.
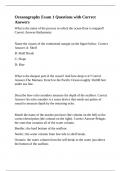
2.2 Estimation of the model (1) using pooled OLS results in the following output:
Dependent Variable: UNEMP
Method: Pooled Least Squares
Date: 08/04/23 Time: 15:35
Sample: 1 30
Included observations: 90
Variable Coefficient Std. Error t-Statistic Prob.
C 14.45269 5.448621 2.652859 0.0091
WAGE -0.000653 0.000031 -21.03073 0.0000
R-squared 0.576151 Mean dependent var 25.07111
Adjusted R-squared 0.567777 S.D. dependent var 6.376463
S.E. of regression 4.151323 Akaike info criterion 5.364909
Sum squared resid 11405.44 Schwarz criterion 5.464373
Log likelihood -267.0622 Hannan-Quinn criter. 5.405048
F-statistic 443.3243 Durbin-Watson stat 1.585187
Prob(F-statistic) 0.000000
1.1 Panel data, also known as longitudinal data, is a type of data that contains
observations of the same units or individuals over a period of time. Researchers use
panel data because it allows them to control for unobserved heterogeneity and to
estimate the effects of variables that do not vary over time. Panel data can also
increase the efficiency of the estimation, as it provides more information than a single
cross-sectional or time-series data set.
In South Africa, panel data has been used in various fields such as economics, health,
and education to study the impact of policies and programs. For example, researchers
have used panel data to examine the effects of affirmative action policies on
employment outcomes, the impact of HIV/AIDS intervention programs on health
outcomes, and the effectiveness of educational interventions on academic performance.
1.2 Random effects and pooled OLS are two popular methods to estimate panel data
models. Random effects are preferred over pooled OLS for several reasons. Firstly,
random effects allow for the presence of unobserved time-invariant heterogeneity
across individuals, which can bias the estimates in pooled OLS. Secondly, random
effects can account for the correlation between the individual-specific effects and the
regressors, which can also bias the estimates in pooled OLS. Finally, random effects
can be more efficient than pooled OLS, especially when the number of individuals is
large relative to the number of time periods.
1.3 To determine which model is better between pooled OLS and least square dummy
variable, researchers can use several methods. Firstly, they can compare the R-
squared and adjusted R-squared of both models, where a higher value indicates a
better fit. Secondly, they can perform a Hausman test, which tests whether the random
effects assumption of the least square dummy variable model is valid. If the test rejects
the null hypothesis of no difference between the two models, then random effects
should be preferred. Thirdly, they can compare the Akaike information criterion (AIC)
and the Bayesian information criterion (BIC) of both models, where a lower value
indicates a better fit. Finally, they can assess the robustness of the results to alternative
specifications and assumptions.
, QUESTION 2
2.1 The a-priori expected relationship between wages and employment is not
straightforward and can vary depending on factors such as the level of economic
development, labor market regulations, and the nature of the industry. In general,
however, there is a negative relationship between wages and employment, as higher
wages may lead to lower demand for labor and higher unemployment rates. This
relationship is known as the "wage-unemployment" curve or the "Phillips curve". The
Phillips curve was first introduced by economist A.W. Phillips in the 1950s, who found
an inverse relationship between wage inflation and unemployment in the UK economy.
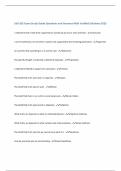
2.2 Estimation of the model (1) using pooled OLS results in the following output:
Dependent Variable: UNEMP
Method: Pooled Least Squares
Date: 08/04/23 Time: 15:35
Sample: 1 30
Included observations: 90
Variable Coefficient Std. Error t-Statistic Prob.
C 14.45269 5.448621 2.652859 0.0091
WAGE -0.000653 0.000031 -21.03073 0.0000
R-squared 0.576151 Mean dependent var 25.07111
Adjusted R-squared 0.567777 S.D. dependent var 6.376463
S.E. of regression 4.151323 Akaike info criterion 5.364909
Sum squared resid 11405.44 Schwarz criterion 5.464373
Log likelihood -267.0622 Hannan-Quinn criter. 5.405048
F-statistic 443.3243 Durbin-Watson stat 1.585187
Prob(F-statistic) 0.000000