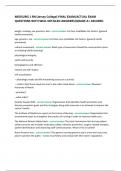
7000 6000 periodic peaks in E 5000 4000 3000 amplitude of the 2000 1000 0 70.5 Why are
there the data? Why does the 81.5 92.5 115.5 59.5 150.5 peaks 1st increase, then decrease? 55 65
75 85 95 105 115 125 135 145 155 operator distance (bp)
Solution
Why there are periodic peaks in data
There are periodic peaks in data indicating that the regions are repressions are almost equidistant.
That is they are having equal distance in base pairs between them.
Why the amplitude of first peak increases then decreases
Answer: As we know the graph is between the repression and distance from the promoter in bp.
Therefore as the distance increases from the promoter there will be lesser control and lesser
repression. This may be due to DNA helical looping which is more with the promoter and starts
decreasing as distance increases from the promoter