Week 1:
Multiple Regression Analysis: statistical method that shows the relationship between two or more
variables, this is usually expressed in a graph, and the method tests the relation between a dependent and
independent variable.
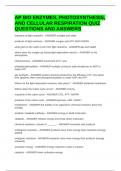
Linear Relationship and Linear Models: a linear relationship is a
relationship between x and y. Linear relationships are in straight lines,
and the formula of this straight line is denoted by the function
y=α + β x , where y denotes the dependant variable value, α is the
constant/y-intercept, and bx is the independent variable multiplied by its
value.
Slope: a number that indicates how much the value of y increases or decreases based on the value of your
predictor when it increases by a unit.
Residual: the error of a variable, the mean value, minus the actual value obtained, for a given variable,
this is used to find squared error.
Prediction equation: : ^y =a+bx As seen, it is very similar to the linear regression formula, and you can
use this to predict a value of the dependent based on the values of your independents or interaction terms.
One property of this equation is that of the least squares.
How To Summarise Size of Residuals: summing up their squared value computing the sum of squared
errors, sum of squared errors is the measure of difference between your prediction line and the observed
data, a residual is (yi - ^y )^2, where yi is the dependent mean or expected, and y is the predicted value,
you square these and sum all of them to find the size of all your residuals.
Properties of Linear Regression Model: it is usually a deterministic model, however we use
probabilistic models here which allow for variability in y at each given value of x (in sum it is
conditional, not marginal distributions).
Probabilistic Model: alpha and bx represent the mean of the conditional distribution of y values rather
than y itself.
This: E( y)=α + β x represents…
→ E(y) is the mean of the conditional distribution of y
→ E stands for expected value, means nothing more than the mean
→ Alpha is the intercept (where the y-axis is crossed, also called constant, y when x is 0)
→ Beta is the slope of your variable of interest
→ x is the specific value of your beta variable if you are using this as a prediction
, Assumptions of Linear Model: that the quantitative variables have a conditional distribution of y that is
normal to any fixed value of x with an unknown standard deviation, it also assumes that the regression is
Linear and that the variable is quantitative, you may place non quantitative variables and nonlinear related
things into an equation and it will still produce something, whether this is accurate is a different story.
Model For Population: y = α + βx + ε, very similar to normal model, except you add an error term
where each observation and data point has had an error recorded, and you add this into the model too. For
sample predictions we use an e instead of this error term which is the residuals of that variable.
Linear Regressions & Correlations: the slope beta of the prediction equation indicates the direction of
an association, while the standardised b coefficient (correlation stat) provides the strength of this
relationship, expressed as values -1 to 1 being perfectly negative and perfectly positive, a regression value
alone does not tell you the strength.
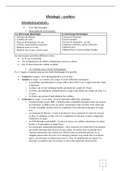
Correlation: standardised version of the b coefficient as stated
above which can also be calculated based on your coefficient and
sample data, using these statistics →
Scatter Plot: line going upward, there is a positive correlation,
downward is most likely negative, if there is no line and random dispersion it is probably no correlation,
and if the line is straight the correlation is entirely 0 with no variation.
Good vs Bad Predictions: least squares method provides the best fitting lines but not always the most
accurate, this is why we used the R squared value, which can also be understood as the explained
variance.
TSS: summarises the variability of the observations on the dependent, also equal to the model sum of
squares plus the residual sum of squares.
SSE: summarises the variability for the conditional distributions.
TSS - SSE → is the regression sum of squares or the model sum of squares.
Marginal vs Conditional? Marginal is any singular variable, usually a dependent, while conditional is
the distribution of that variable based on the values of another variable in the dataset.
Properties of R Squared? It falls between 0 and 1, representing 0 and 100 percent of the variance, if b is
0 then so is the r squared because there is no coefficient, and this does not regard any unit of
measurement, it is just regarding variation, the higher the value of r the stronger linear association and the
larger amount of variance in dependant can be explained.
F-Test: The f test of overall significance allows for a formal test of your models, if there is a significant f
value, higher than its critical f for the df, then our model contains at least one significant coefficient and is
worth being looked at.
Multiple Regression Analysis: statistical method that shows the relationship between two or more
variables, this is usually expressed in a graph, and the method tests the relation between a dependent and
independent variable.
Linear Relationship and Linear Models: a linear relationship is a
relationship between x and y. Linear relationships are in straight lines,
and the formula of this straight line is denoted by the function
y=α + β x , where y denotes the dependant variable value, α is the
constant/y-intercept, and bx is the independent variable multiplied by its
value.
Slope: a number that indicates how much the value of y increases or decreases based on the value of your
predictor when it increases by a unit.
Residual: the error of a variable, the mean value, minus the actual value obtained, for a given variable,
this is used to find squared error.
Prediction equation: : ^y =a+bx As seen, it is very similar to the linear regression formula, and you can
use this to predict a value of the dependent based on the values of your independents or interaction terms.
One property of this equation is that of the least squares.
How To Summarise Size of Residuals: summing up their squared value computing the sum of squared
errors, sum of squared errors is the measure of difference between your prediction line and the observed
data, a residual is (yi - ^y )^2, where yi is the dependent mean or expected, and y is the predicted value,
you square these and sum all of them to find the size of all your residuals.
Properties of Linear Regression Model: it is usually a deterministic model, however we use
probabilistic models here which allow for variability in y at each given value of x (in sum it is
conditional, not marginal distributions).
Probabilistic Model: alpha and bx represent the mean of the conditional distribution of y values rather
than y itself.
This: E( y)=α + β x represents…
→ E(y) is the mean of the conditional distribution of y
→ E stands for expected value, means nothing more than the mean
→ Alpha is the intercept (where the y-axis is crossed, also called constant, y when x is 0)
→ Beta is the slope of your variable of interest
→ x is the specific value of your beta variable if you are using this as a prediction
, Assumptions of Linear Model: that the quantitative variables have a conditional distribution of y that is
normal to any fixed value of x with an unknown standard deviation, it also assumes that the regression is
Linear and that the variable is quantitative, you may place non quantitative variables and nonlinear related
things into an equation and it will still produce something, whether this is accurate is a different story.
Model For Population: y = α + βx + ε, very similar to normal model, except you add an error term
where each observation and data point has had an error recorded, and you add this into the model too. For
sample predictions we use an e instead of this error term which is the residuals of that variable.
Linear Regressions & Correlations: the slope beta of the prediction equation indicates the direction of
an association, while the standardised b coefficient (correlation stat) provides the strength of this
relationship, expressed as values -1 to 1 being perfectly negative and perfectly positive, a regression value
alone does not tell you the strength.
Correlation: standardised version of the b coefficient as stated
above which can also be calculated based on your coefficient and
sample data, using these statistics →
Scatter Plot: line going upward, there is a positive correlation,
downward is most likely negative, if there is no line and random dispersion it is probably no correlation,
and if the line is straight the correlation is entirely 0 with no variation.
Good vs Bad Predictions: least squares method provides the best fitting lines but not always the most
accurate, this is why we used the R squared value, which can also be understood as the explained
variance.
TSS: summarises the variability of the observations on the dependent, also equal to the model sum of
squares plus the residual sum of squares.
SSE: summarises the variability for the conditional distributions.
TSS - SSE → is the regression sum of squares or the model sum of squares.
Marginal vs Conditional? Marginal is any singular variable, usually a dependent, while conditional is
the distribution of that variable based on the values of another variable in the dataset.
Properties of R Squared? It falls between 0 and 1, representing 0 and 100 percent of the variance, if b is
0 then so is the r squared because there is no coefficient, and this does not regard any unit of
measurement, it is just regarding variation, the higher the value of r the stronger linear association and the
larger amount of variance in dependant can be explained.
F-Test: The f test of overall significance allows for a formal test of your models, if there is a significant f
value, higher than its critical f for the df, then our model contains at least one significant coefficient and is
worth being looked at.