Ana Ligthart, 6299483
Assignments
WEEK4 - Seminar 4.1
All relevant statistical concepts have been discussed earlier, but repeating the
discussion of several concepts is always good.
In this seminar regression analysis is combined with statistical testing and the results of a t-
test are compared with that of a regression analysis.
Question 1 see SPSS instructions below!
Consider the following SPSS data file: ‘fish.sav’.
A randomized clinical trial has been conducted to analyze the effect of fish consumption
(fish or meat) on bleeding time. There were 84 volunteers coming from three different
research centers (Maastricht, Tromso and Zeist). Each person was measured twice: a
baseline measurement before the fish/meat treatment (Bt0 in minutes) and a post
measurement 6 weeks after the intervention (Bt6 in minutes).
A comparison is made between eating fish and eating meat (variable Fish) with respect to
the change in bleeding time (Bt6 – Bt0). It was hypothesized (according to theory or what
we want to find out) that the average change in bleeding time of fish eaters differs from that
of the meat eaters. The question is whether we can confirm this (research hypothesis).
For this assignment, we only select individuals from Maastricht (n = 40).
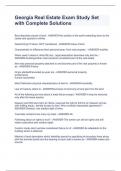
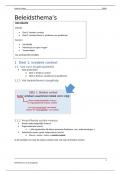
a. Produce a graph of the difference in post-premeasurement bleeding time (Bt6 – Bt0)
against fish and meat eaters and describe what you see.
, Er is een verschil tussen meat and fish-eaters bij de verandering in bleeding time
voor en na de interventie. Viseters zijn meer veranderd dan vleeseters in de
positieve zin.
b. Formulate the null and alternative hypothesis that is being tested.
H 0 : μfish=μ meat
H A : μ fish ≠ μmeat
c. Perform the appropriate test for this hypothesis and discuss your conclusion.
Assignments
WEEK4 - Seminar 4.1
All relevant statistical concepts have been discussed earlier, but repeating the
discussion of several concepts is always good.
In this seminar regression analysis is combined with statistical testing and the results of a t-
test are compared with that of a regression analysis.
Question 1 see SPSS instructions below!
Consider the following SPSS data file: ‘fish.sav’.
A randomized clinical trial has been conducted to analyze the effect of fish consumption
(fish or meat) on bleeding time. There were 84 volunteers coming from three different
research centers (Maastricht, Tromso and Zeist). Each person was measured twice: a
baseline measurement before the fish/meat treatment (Bt0 in minutes) and a post
measurement 6 weeks after the intervention (Bt6 in minutes).
A comparison is made between eating fish and eating meat (variable Fish) with respect to
the change in bleeding time (Bt6 – Bt0). It was hypothesized (according to theory or what
we want to find out) that the average change in bleeding time of fish eaters differs from that
of the meat eaters. The question is whether we can confirm this (research hypothesis).
For this assignment, we only select individuals from Maastricht (n = 40).
a. Produce a graph of the difference in post-premeasurement bleeding time (Bt6 – Bt0)
against fish and meat eaters and describe what you see.
, Er is een verschil tussen meat and fish-eaters bij de verandering in bleeding time
voor en na de interventie. Viseters zijn meer veranderd dan vleeseters in de
positieve zin.
b. Formulate the null and alternative hypothesis that is being tested.
H 0 : μfish=μ meat
H A : μ fish ≠ μmeat
c. Perform the appropriate test for this hypothesis and discuss your conclusion.