Notes – Statistics 1 2023
Week 1: 03/04/2023
Summarising data
Explanatory and response variables
- The explanatory variable might influence the dependent variable.
- Explanatory/ independent variable (cause) is often written as x.
- Response/ dependent variable (outcome) is often written as y.
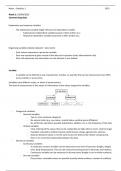
Organising variables (tabular dataset) – data matrix
- Each column represents a particular variable.
- Each row represents a given record of the data set in question (case/ observational unit).
- Each cell represents one observation on one element in our dataset.
Variable
- A variable can be defined as any characteristic, number, or quantity that can be measured and can differ
across entities or across time.
Variables have different scales, or levels of measurement.
The level of measurement is the nature of information of the values assigned to variables.
- Categorical variables
- Nominal variables
- Two or more exclusive categories
- No natural order (e.g., eye colour, marital status, political party affiliation)
- No arithmetic operations possible (subtraction, addition, etc.), only frequency of the data
- Ordinal variables
- Clear ordering of the values that can be ranked (low to high, little to much, small to large)
- Examples: education, political interest, performance ratings, agreements, opinions
- Distance between values is not the same across the levels (only relative comparisons),
there is no numerical relationship between the data.
- Numerical variables
- Continuous variables
- A continuous numeric variable can be measured to any level of precision (height, weight,
time, body temperature). They can be measured and expressed in decimals and fractions.
- Continuous variables can be measured in discrete terms (height in cm in whole numbers).
- Discrete variables
- Only certain, countable values are possible (usually whole numbers: number of conflicts).
,Notes – Statistics 1 2023
Frequency distribution
When we collect data, we can show how these values are distributed in relation to other values.
- Frequency distribution -> display of the pattern of frequencies of a variable of a statistical data set.
- Shows all the possible values/ intervals of the data and how often/ frequent they occur.
- E.g., nominal variables like frequency of religion, ordinal variable like level of interest
- Symmetry
- Symmetric/ unimodal distribution: values one side of the distribution are mirrored by other side.
- Uniform distribution: every possible outcome has an equal probability of occurring.
- Bimodal distribution: there are two values that are most common.
- Multimodal distribution: there are more than two values that are common.
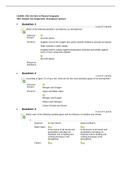
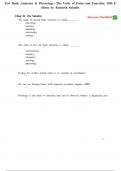
- Skewness (asymmetrical distributions)
- Negative (left) skew: mass concentrated on the right; left tail is longer.
- Positive (right) skew: mass concentrated on the left; right tail is longer.
Summarising and describing distributions of variables
Calculate measures to summarise data:
- Measure of central tendency -> a value that describes a set of data by identifying the central position
within that set of data.
Level of measurement Measures of central tendency
Nominal variables Mode
Ordinal variables Median + Mode
Numeric variables Mean + Median + Mode
- Mode -> most frequent score in the data set (unimodal, bimodal, multimodal)
- Median -> middle score for a set of data that has been arranged in order of magnitude.
- If there are uneven number of observations, there is only one value in the middle.
- If there are an even number of observations, there will be two values in the middle, and
the median is taken as their average (x1 + x2)/2.
- The median is a robust statistic because it is not influenced by outliers.
- (Arithmetic) Mean -> the mean/ average (x̄) is a common way to measure the centre of a
distribution of data. To compute the mean, we add up all the observed values and divide by the
number of observations.
𝑥1 + 𝑥2 + … + 𝑥𝑛 ∑𝑛𝑖=1 𝑥𝑖
𝑥̄ = or 𝑥̄ =
𝑛 𝑛
- The mean is sensitive to extreme values, the median is more robust.
- The population mean has a special label: µ (mu) which represents the average of all
observations. We often estimate µ using the sample mean x̄.
,Notes – Statistics 1 2023
- Measure of dispersion/ spread -> how similar or varied the set of observed values for a particular variable
Level of measurement Measures of central tendency
Nominal variables No measure of dispersion possible
Ordinal variables Range, Interquartile range
Numeric variables Range, Interquartile range,
variance/ standard deviation
- Range -> the difference between the lowest and highest values (max – min)
- Splitting data into equal parts, namely quantiles.
- Percentile: distribution is divided into 100 parts (hundredths)
- Deciles: distribution is divided into 10 parts (tenths)
- Quintiles: distribution is divided into 5 parts (fifths)
- Quartiles: distribution is divided into 4 parts (quarters)
- Interquartile range (IQR) -> the IQR is the range of the middle 50% of the data, calculated
by subtracting the 1st quartile from the 3rd quartile (Q3 – Q1).
- The 1st quartile is on the 25% of the data. If there is no clear mean, then we need
to calculate it (x1 + x2)/2. The same for the 3rd quartile which is 75%.
- If there is an even amount of data, we split the data into two halves and select
the two numbers in the middle.
- The interquartile range, like the median, is a robust statistic.
- Variances and standard deviation
- The distance of an observation from its mean is called deviation: (xi – x̄ = deviation).
- Total deviance -> the sum of all deviances ∑𝑛𝑖=1(𝑥𝑖 − x̄ )
- However, it is always 0 and therefore is not a useful measure of spread.
- Instead, we calculate the sum of squared errors ∑𝑛𝑖=1(𝑥𝑖 − x̄ )2
- However, this is not a useful measure to compare.
- Solution: the variance (s2) is calculated through squaring the deviations and then taking
an average. We divide by n – 1 when computing a sample’s variance.
2 ∑𝑛𝑖=1(𝑥𝑖 −x̄)
2
𝑉𝑎𝑟𝑖𝑎𝑛𝑐𝑒: 𝑠 =
𝑛−1
- The standard deviation (s or 𝜕) roughly describes how far away the typical observation is
from the mean. It is defined as the square root of the sample variance. A larger standard
deviation means that there is a bigger spread/ dispersion around the mean.
𝑆𝑡𝑎𝑛𝑑𝑎𝑟𝑑 𝑑𝑒𝑣𝑖𝑎𝑡𝑖𝑜𝑛: 𝑠 = √𝑠 2
- Steps to get to the standard deviation:
- Calculate the deviance (xi – x̄).
- Square the deviances and sum the solutions.
- Divide the sum of squares with n – 1 and take square root of the solution.
Robust statistics
- The median and IQR are called robust statistics because extreme observations have little effect on their
values: moving the most extreme value generally has little influence on these statistics. The median and
IQR are only sensitive to numbers near Q1, the median, and Q3.
- On the other hand, the mean and standard deviation are more heavily influenced by changes in extreme
observations, which can be important in some situations.
, Notes – Statistics 1 2023
Week 2: 10/04/2023
Visualising data
The goal of converting data into a visual context is to make it easier to explore data, identify patterns, trends, and
outliers in a data set. A good visualisation also shows relationships and tells a story.
Bad graphs
- Graphs should not provide a distorted picture of the values they portray.
- Do not manipulate the Y-axis (different distances between values).
- Avoid unnecessary complexity (chartjunk) via irrelevant decorations or 3D effects.
- Always have clear labels so that the readers clearly understand the graph.
- No cherry picking of data in general.
- Pie charts should not be used.
Graphs according to the variables
Numerical variables
- Single variable
- Dot plot
- Histogram
- Box plot
- Two variables
- Scatterplot
Categorical variables
- Bar plot
Examining numerical data
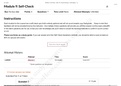
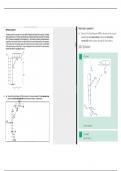
Dot plots
- A dot plot is a one-variable scatterplot, used when only one variable is of interest.
- The dot plot shows the exact value for each observation which is useful for smaller data sets. It shows the
frequency of a single numerical variable, e.g., number of books read over the summer.
- A dot plot works best if the sample size is smaller than 50. It becomes hard to read with larger samples.
- This is a stacked dot plot:
Week 1: 03/04/2023
Summarising data
Explanatory and response variables
- The explanatory variable might influence the dependent variable.
- Explanatory/ independent variable (cause) is often written as x.
- Response/ dependent variable (outcome) is often written as y.
Organising variables (tabular dataset) – data matrix
- Each column represents a particular variable.
- Each row represents a given record of the data set in question (case/ observational unit).
- Each cell represents one observation on one element in our dataset.
Variable
- A variable can be defined as any characteristic, number, or quantity that can be measured and can differ
across entities or across time.
Variables have different scales, or levels of measurement.
The level of measurement is the nature of information of the values assigned to variables.
- Categorical variables
- Nominal variables
- Two or more exclusive categories
- No natural order (e.g., eye colour, marital status, political party affiliation)
- No arithmetic operations possible (subtraction, addition, etc.), only frequency of the data
- Ordinal variables
- Clear ordering of the values that can be ranked (low to high, little to much, small to large)
- Examples: education, political interest, performance ratings, agreements, opinions
- Distance between values is not the same across the levels (only relative comparisons),
there is no numerical relationship between the data.
- Numerical variables
- Continuous variables
- A continuous numeric variable can be measured to any level of precision (height, weight,
time, body temperature). They can be measured and expressed in decimals and fractions.
- Continuous variables can be measured in discrete terms (height in cm in whole numbers).
- Discrete variables
- Only certain, countable values are possible (usually whole numbers: number of conflicts).
,Notes – Statistics 1 2023
Frequency distribution
When we collect data, we can show how these values are distributed in relation to other values.
- Frequency distribution -> display of the pattern of frequencies of a variable of a statistical data set.
- Shows all the possible values/ intervals of the data and how often/ frequent they occur.
- E.g., nominal variables like frequency of religion, ordinal variable like level of interest
- Symmetry
- Symmetric/ unimodal distribution: values one side of the distribution are mirrored by other side.
- Uniform distribution: every possible outcome has an equal probability of occurring.
- Bimodal distribution: there are two values that are most common.
- Multimodal distribution: there are more than two values that are common.
- Skewness (asymmetrical distributions)
- Negative (left) skew: mass concentrated on the right; left tail is longer.
- Positive (right) skew: mass concentrated on the left; right tail is longer.
Summarising and describing distributions of variables
Calculate measures to summarise data:
- Measure of central tendency -> a value that describes a set of data by identifying the central position
within that set of data.
Level of measurement Measures of central tendency
Nominal variables Mode
Ordinal variables Median + Mode
Numeric variables Mean + Median + Mode
- Mode -> most frequent score in the data set (unimodal, bimodal, multimodal)
- Median -> middle score for a set of data that has been arranged in order of magnitude.
- If there are uneven number of observations, there is only one value in the middle.
- If there are an even number of observations, there will be two values in the middle, and
the median is taken as their average (x1 + x2)/2.
- The median is a robust statistic because it is not influenced by outliers.
- (Arithmetic) Mean -> the mean/ average (x̄) is a common way to measure the centre of a
distribution of data. To compute the mean, we add up all the observed values and divide by the
number of observations.
𝑥1 + 𝑥2 + … + 𝑥𝑛 ∑𝑛𝑖=1 𝑥𝑖
𝑥̄ = or 𝑥̄ =
𝑛 𝑛
- The mean is sensitive to extreme values, the median is more robust.
- The population mean has a special label: µ (mu) which represents the average of all
observations. We often estimate µ using the sample mean x̄.
,Notes – Statistics 1 2023
- Measure of dispersion/ spread -> how similar or varied the set of observed values for a particular variable
Level of measurement Measures of central tendency
Nominal variables No measure of dispersion possible
Ordinal variables Range, Interquartile range
Numeric variables Range, Interquartile range,
variance/ standard deviation
- Range -> the difference between the lowest and highest values (max – min)
- Splitting data into equal parts, namely quantiles.
- Percentile: distribution is divided into 100 parts (hundredths)
- Deciles: distribution is divided into 10 parts (tenths)
- Quintiles: distribution is divided into 5 parts (fifths)
- Quartiles: distribution is divided into 4 parts (quarters)
- Interquartile range (IQR) -> the IQR is the range of the middle 50% of the data, calculated
by subtracting the 1st quartile from the 3rd quartile (Q3 – Q1).
- The 1st quartile is on the 25% of the data. If there is no clear mean, then we need
to calculate it (x1 + x2)/2. The same for the 3rd quartile which is 75%.
- If there is an even amount of data, we split the data into two halves and select
the two numbers in the middle.
- The interquartile range, like the median, is a robust statistic.
- Variances and standard deviation
- The distance of an observation from its mean is called deviation: (xi – x̄ = deviation).
- Total deviance -> the sum of all deviances ∑𝑛𝑖=1(𝑥𝑖 − x̄ )
- However, it is always 0 and therefore is not a useful measure of spread.
- Instead, we calculate the sum of squared errors ∑𝑛𝑖=1(𝑥𝑖 − x̄ )2
- However, this is not a useful measure to compare.
- Solution: the variance (s2) is calculated through squaring the deviations and then taking
an average. We divide by n – 1 when computing a sample’s variance.
2 ∑𝑛𝑖=1(𝑥𝑖 −x̄)
2
𝑉𝑎𝑟𝑖𝑎𝑛𝑐𝑒: 𝑠 =
𝑛−1
- The standard deviation (s or 𝜕) roughly describes how far away the typical observation is
from the mean. It is defined as the square root of the sample variance. A larger standard
deviation means that there is a bigger spread/ dispersion around the mean.
𝑆𝑡𝑎𝑛𝑑𝑎𝑟𝑑 𝑑𝑒𝑣𝑖𝑎𝑡𝑖𝑜𝑛: 𝑠 = √𝑠 2
- Steps to get to the standard deviation:
- Calculate the deviance (xi – x̄).
- Square the deviances and sum the solutions.
- Divide the sum of squares with n – 1 and take square root of the solution.
Robust statistics
- The median and IQR are called robust statistics because extreme observations have little effect on their
values: moving the most extreme value generally has little influence on these statistics. The median and
IQR are only sensitive to numbers near Q1, the median, and Q3.
- On the other hand, the mean and standard deviation are more heavily influenced by changes in extreme
observations, which can be important in some situations.
, Notes – Statistics 1 2023
Week 2: 10/04/2023
Visualising data
The goal of converting data into a visual context is to make it easier to explore data, identify patterns, trends, and
outliers in a data set. A good visualisation also shows relationships and tells a story.
Bad graphs
- Graphs should not provide a distorted picture of the values they portray.
- Do not manipulate the Y-axis (different distances between values).
- Avoid unnecessary complexity (chartjunk) via irrelevant decorations or 3D effects.
- Always have clear labels so that the readers clearly understand the graph.
- No cherry picking of data in general.
- Pie charts should not be used.
Graphs according to the variables
Numerical variables
- Single variable
- Dot plot
- Histogram
- Box plot
- Two variables
- Scatterplot
Categorical variables
- Bar plot
Examining numerical data
Dot plots
- A dot plot is a one-variable scatterplot, used when only one variable is of interest.
- The dot plot shows the exact value for each observation which is useful for smaller data sets. It shows the
frequency of a single numerical variable, e.g., number of books read over the summer.
- A dot plot works best if the sample size is smaller than 50. It becomes hard to read with larger samples.
- This is a stacked dot plot: