Field chapter 1 - 19 Summary by Jenisha van Loo
Table of contents
• Chapter 1 Why is my evil lecturer forcing me to learn statistics? p. 2
• Chapter 2 The SPINE of statistics p. 4
• Chapter 3 The phoenix of statistics p. 6
• Chapter 4 The IBM SPSS statistics environment p. 8
• Chapter 5 Exploring data with graphs p. 8
• Chapter 6 The beast of bias p. 9
• Chapter 7 Non-parametric models p. 11
• Chapter 8 Correlation p. 14
• Chapter 9 The linear model (multiple regression) p. 15
• Chapter 10 Comparing two means p. 18
• Chapter 11 Mediation and moderation p. 20
• Chapter 12 GLM 1: Comparing several independent means p. 23
• Chapter 13 GLM 2: Comparing means adjusted for other predictors p. 25
• Chapter 14 GLM 3: Factorial designs p. 27
• Chapter 15 GLM 4: Repeated-measures designs p. 29
• Chapter 16 GLM 5: Mixed desigs p. 31
• Chapter 17 Multivariate analysis of variance (MANOVA) p. 31
• Chapter 18 Exploratory factor analysis and reliability analysis p. 33
• Chapter 19 Categorical outcomes: chi-square p. 38
1
,Field chapter 1 - 19 Summary by Jenisha van Loo
Why is my evil lecturer forcing me to learn statistics?
Field | Chapter 1
Empirical cycle
The empirical cycle of doing research includes the following steps:
1) Observation: an observation sparks an idea for a new research hypothesis à I only know people
with a horrible mother-in-law
2) Induction: it is inferred that a statement is true in all cases, as a general rule (hypothesis) à All
mothers-in-law are horrible
3) Deduction: the hypothesis is transformed into a prediction, by operationalization à All 10
participants will say they have a horrible mother-in-law
4) Testing: the hypothesis is tested by comparing the data to the prediction à 8 out of 10 participants
reported having a horrible mother-in-law
5) Evaluation: results are interpreted in terms of the hypothesis à Not all mothers-in-law are horrible
Falsification = the act of disproving a hypothesis or theory.
Measurement Concepts
Categorical variables
= entities that are divided into distinct categories. Categorical variables can take several forms:
• Binary variable: there are only 2 categories (yes or no).
• Nominal variable: there are more than 2 categories (species).
• Ordinal variable: there are more than 2 categories and they are ordered (place in a competition).
Continuous variables
= entities that get a distinct score. Continuous variables can also take several forms:
• Interval variable: can fall below 0 and therefore does not have a meaningful 0 point: 0 does not
mean that it is absent (if the temperature is 0, this does not mean that there is no temperature).
• Ratio variable: does have a meaningful 0 point, meaning a complete absence. Ratio variables never
fall below 0 (age, weight, height; you cannot weigh less than 0).
Independent variable (IV)
= predictor variable = a variable thought to be the cause of some effect.
Dependent variable (DV)
= outcome variable = a variable thought to be affected by changes in the IV.
Validity = the extent to which an instrument measures what it is supposed to measure.
Measurement error
= a difference between the numbers we use to represent the variable and the actual value of the
variable. In reality you weigh 41kg but a scale says 43kg à the measurement error of the scale is 2kg.
Reliability
= the extent to which an instrument measures consistently across time (test-retest reliability) and
different situations. We want the scale to say 43kg when we weigh ourselves in our own home or
outside; and when we weigh now or after some minutes.
• Test-retest reliability = extent to which a measure produces similar scores at 2 points in time.
2
, Field chapter 1 - 19 Summary by Jenisha van Loo
Research Designs
Correlational research methods
= methods used to observe natural events without directly interfering. Variables can be measured at a
single point in time, or repeatedly at different time points (longitudinal research).
Experimental research methods
= methods used to observe events by manipulating the independent variable and keeping all other
factors constant. This way confounding variables can be ruled out. There are 2 important types:
• Between-groups design: different groups of subjects take part in each experimental condition (an
experimental- and a control-group).
• Within-subject design: every subject takes part in every condition (pre-/post-measurement).
Systematic variation
= variation due to the experimenter manipulating something in 1 experimental condition but not in the
other. Randomization eliminates most sources of systematic variation.
Analyzing Data
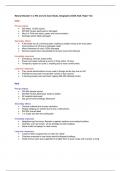
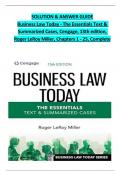
Normal distribution
= data that is symmetric around the mean: data near the mean are
more frequent than data far from it. A distribution can deviate from
normal by: a) a lack of symmetry (skew) and b) pointiness (kurtosis).
Mean
= the average score. Add up all the scores and divide them by the total number of
scores. The mean can be influenced by extreme scores and skewed distributions. The
mean of ‘1, 2, 3, 3, 4, 5’ is 3 (1+2+3+3+4+5 : 6).
Mode
= the score that occurs most frequently (tallest bar in a frequency distribution). A problem is that it can
take on several values (when multiple bars are the highest). The mode of ‘1, 2, 3, 3, 4, 5’ is 3.
Median
= the middle score when scores are ranked in order of magnitude. When there is an even number of
scores, the median is the average of the 2 middle scores. The median is relatively unaffected by
extreme scores and skewed distributions. The median of ‘1, 2, 3, 4, 4, 5’ is 3.5 (3+4 : 2).
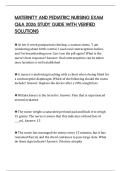
Dispersion
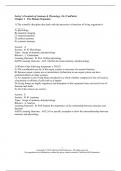
Interquartile range
= the middle 50% of the scores. There are 3 quartiles.
§ Quartiles = values that split the data into 4 equal
parts.
Deviance
= error = the difference between an individual score (xi) and the mean (x̄).
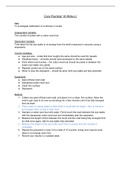
Sum of squared errors (SS)
= the total dispersion. A problem of the SS is that its size will
depend on how many scores we have in the data, so we can’t
compare it across samples that differ in size.
3
Table of contents
• Chapter 1 Why is my evil lecturer forcing me to learn statistics? p. 2
• Chapter 2 The SPINE of statistics p. 4
• Chapter 3 The phoenix of statistics p. 6
• Chapter 4 The IBM SPSS statistics environment p. 8
• Chapter 5 Exploring data with graphs p. 8
• Chapter 6 The beast of bias p. 9
• Chapter 7 Non-parametric models p. 11
• Chapter 8 Correlation p. 14
• Chapter 9 The linear model (multiple regression) p. 15
• Chapter 10 Comparing two means p. 18
• Chapter 11 Mediation and moderation p. 20
• Chapter 12 GLM 1: Comparing several independent means p. 23
• Chapter 13 GLM 2: Comparing means adjusted for other predictors p. 25
• Chapter 14 GLM 3: Factorial designs p. 27
• Chapter 15 GLM 4: Repeated-measures designs p. 29
• Chapter 16 GLM 5: Mixed desigs p. 31
• Chapter 17 Multivariate analysis of variance (MANOVA) p. 31
• Chapter 18 Exploratory factor analysis and reliability analysis p. 33
• Chapter 19 Categorical outcomes: chi-square p. 38
1
,Field chapter 1 - 19 Summary by Jenisha van Loo
Why is my evil lecturer forcing me to learn statistics?
Field | Chapter 1
Empirical cycle
The empirical cycle of doing research includes the following steps:
1) Observation: an observation sparks an idea for a new research hypothesis à I only know people
with a horrible mother-in-law
2) Induction: it is inferred that a statement is true in all cases, as a general rule (hypothesis) à All
mothers-in-law are horrible
3) Deduction: the hypothesis is transformed into a prediction, by operationalization à All 10
participants will say they have a horrible mother-in-law
4) Testing: the hypothesis is tested by comparing the data to the prediction à 8 out of 10 participants
reported having a horrible mother-in-law
5) Evaluation: results are interpreted in terms of the hypothesis à Not all mothers-in-law are horrible
Falsification = the act of disproving a hypothesis or theory.
Measurement Concepts
Categorical variables
= entities that are divided into distinct categories. Categorical variables can take several forms:
• Binary variable: there are only 2 categories (yes or no).
• Nominal variable: there are more than 2 categories (species).
• Ordinal variable: there are more than 2 categories and they are ordered (place in a competition).
Continuous variables
= entities that get a distinct score. Continuous variables can also take several forms:
• Interval variable: can fall below 0 and therefore does not have a meaningful 0 point: 0 does not
mean that it is absent (if the temperature is 0, this does not mean that there is no temperature).
• Ratio variable: does have a meaningful 0 point, meaning a complete absence. Ratio variables never
fall below 0 (age, weight, height; you cannot weigh less than 0).
Independent variable (IV)
= predictor variable = a variable thought to be the cause of some effect.
Dependent variable (DV)
= outcome variable = a variable thought to be affected by changes in the IV.
Validity = the extent to which an instrument measures what it is supposed to measure.
Measurement error
= a difference between the numbers we use to represent the variable and the actual value of the
variable. In reality you weigh 41kg but a scale says 43kg à the measurement error of the scale is 2kg.
Reliability
= the extent to which an instrument measures consistently across time (test-retest reliability) and
different situations. We want the scale to say 43kg when we weigh ourselves in our own home or
outside; and when we weigh now or after some minutes.
• Test-retest reliability = extent to which a measure produces similar scores at 2 points in time.
2
, Field chapter 1 - 19 Summary by Jenisha van Loo
Research Designs
Correlational research methods
= methods used to observe natural events without directly interfering. Variables can be measured at a
single point in time, or repeatedly at different time points (longitudinal research).
Experimental research methods
= methods used to observe events by manipulating the independent variable and keeping all other
factors constant. This way confounding variables can be ruled out. There are 2 important types:
• Between-groups design: different groups of subjects take part in each experimental condition (an
experimental- and a control-group).
• Within-subject design: every subject takes part in every condition (pre-/post-measurement).
Systematic variation
= variation due to the experimenter manipulating something in 1 experimental condition but not in the
other. Randomization eliminates most sources of systematic variation.
Analyzing Data
Normal distribution
= data that is symmetric around the mean: data near the mean are
more frequent than data far from it. A distribution can deviate from
normal by: a) a lack of symmetry (skew) and b) pointiness (kurtosis).
Mean
= the average score. Add up all the scores and divide them by the total number of
scores. The mean can be influenced by extreme scores and skewed distributions. The
mean of ‘1, 2, 3, 3, 4, 5’ is 3 (1+2+3+3+4+5 : 6).
Mode
= the score that occurs most frequently (tallest bar in a frequency distribution). A problem is that it can
take on several values (when multiple bars are the highest). The mode of ‘1, 2, 3, 3, 4, 5’ is 3.
Median
= the middle score when scores are ranked in order of magnitude. When there is an even number of
scores, the median is the average of the 2 middle scores. The median is relatively unaffected by
extreme scores and skewed distributions. The median of ‘1, 2, 3, 4, 4, 5’ is 3.5 (3+4 : 2).
Dispersion
Interquartile range
= the middle 50% of the scores. There are 3 quartiles.
§ Quartiles = values that split the data into 4 equal
parts.
Deviance
= error = the difference between an individual score (xi) and the mean (x̄).
Sum of squared errors (SS)
= the total dispersion. A problem of the SS is that its size will
depend on how many scores we have in the data, so we can’t
compare it across samples that differ in size.
3