Samenvatting Statistics (formuleblad op blackboard)
1.1 Using Data to Answer Statistical Questions
Statistics as a field can be broadly viewed as a way of thinking about data and quantifying
uncertainty, not a maze of numbers and messy formulas.
Statistics: the art and science of designing studies and analyzing the data that those studies
produce. It’s ultimate goal is translating data into knowledge and understanding of the world
around us. In short, statistics is the art and science of learning from data.
The investigative process of statistical problem solving:
1. formulate a statistical question
2. collect data
3. analyze data
4. interpret results
3 scenarios in which statistics are needed:
- predicting an election using an exit poll
- making conclusions in medical research studies
- using a survey to investigate people’s believes
design: planning how to obtain data to answer the questions of interest
description: summarizing and analyzing the data that are obtained
inference: making decisions and predictions based on the data for answering the statistical
question
Statistical description and inference are complementary ways of analyzing data. Statistical
description provides useful summaries and helps you find patterns in the data, while inference
helps you make predictions and decide whether observed patterns are meaningful.
probability: a framework for quantifying how likely various possible outcomes are
1.2 Sample versus population
subjects: the entities that we measure in a study
population: the total set of subjects in which we are interested
sample: the subset of the population for whom we have data, often randomly selected
We observe samples, but are interested in populations.
descriptive statistics: methods for summarizing the collected data
—> The summaries usually consist of graphs and numbers such as averages and percentages.
A descriptive statistical analysis usually combines graphical and numerical summaries.
Pagina 1
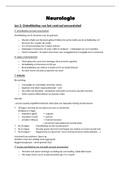
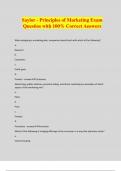
,bar graph —>
inferential statistics: methods of making decisions or predictions about a population, based on
data obtained from a sample of that population
An important aspect of statistical inference involves reporting the likely precision of a prediction.
How close is the sample value likely to be to the true unknown percentage of the population?
In a confidence interval, the range of values above and below the sample statistic is called the
margin of error.
parameter: a numerical summary of the population
statistic: a numerical summary of a sample taken from the population
random sampling: a sample tends to be a good reflection of a population when each subject in
the population has the same chance of being included in that sample
—> random sampling allows us to make powerful inferences about populations
—> randomness is also crucial to performing experiments well
Just as people vary, so do samples vary. With random sampling, the amount of variability from
sample to sample is actually quite predictable.
1.3 Using calculators and computers
To make statistical analysis easier, large sets of data are organized in a data file.
databases: existing archived collections of data files
—> always check sources
applet: a small application program for performing a special task
—> Using an applet, you can take samples from artificial populations and analyze them to
discover properties of statistical methods applied to those samples.
simulation: using a computer to mimic what would actually happen if you selected a sample and
used statistics in real life
2.1 different types of data
variable: any characteristic observed in a study
—> the term variable highlights that data values vary
The data values that we observe for a variable are called observations. Each observation can be a
number such as the number of centimeters of precipitation in a day. Or each observation belongs
to a category, such as yes or no for whether it rained.
Pagina 2
, A variable is called categorical if each observation belongs to one of a set of categories.
—> important: the relative number of observations
- What percentage of students..?
A variable is called quantitative if observations on it take numerical values that represent different
magnitudes of the variable.
—> important: center, variability, spread
- What is a typical amount?
- Is there much variation?
quantity = magnitude = how much
Quantitative variables:
- discrete
- continuous
A quantitative variable is discrete if its possible values from a set of separate numbers.
-> 0, 1, 2, 3
- a finite number of possible values
- ‘’the number of..’’
A quantitative variable is continuous if its possible values form an interval
—> 0,3763765 or 4,56666
- infinite continuum of possible values
- zo precies mogelijk
This is important because the method used to analyze a data set will depend on the type of
variable the data represent.
The category with the highest frequency is called the modal category. For a quantitative variable,
the numerical value that occurs most frequently is the mode.
proportion: the frequency of observations in a category divided by the total number of
observations
percentage: the proportion multiplied by 100
Proportions and percentages are also called relative frequencies and serve as a way to summarize
the measurements in categories of a categorical variable.
Frequency table: a listing of possible values for a variable, together with the number of
observations for each value.
frequency = count
Don’t mistake the frequencies as values of a variable. They are merely a summary of how many
times the observation occurred in each category.
Pagina 3
1.1 Using Data to Answer Statistical Questions
Statistics as a field can be broadly viewed as a way of thinking about data and quantifying
uncertainty, not a maze of numbers and messy formulas.
Statistics: the art and science of designing studies and analyzing the data that those studies
produce. It’s ultimate goal is translating data into knowledge and understanding of the world
around us. In short, statistics is the art and science of learning from data.
The investigative process of statistical problem solving:
1. formulate a statistical question
2. collect data
3. analyze data
4. interpret results
3 scenarios in which statistics are needed:
- predicting an election using an exit poll
- making conclusions in medical research studies
- using a survey to investigate people’s believes
design: planning how to obtain data to answer the questions of interest
description: summarizing and analyzing the data that are obtained
inference: making decisions and predictions based on the data for answering the statistical
question
Statistical description and inference are complementary ways of analyzing data. Statistical
description provides useful summaries and helps you find patterns in the data, while inference
helps you make predictions and decide whether observed patterns are meaningful.
probability: a framework for quantifying how likely various possible outcomes are
1.2 Sample versus population
subjects: the entities that we measure in a study
population: the total set of subjects in which we are interested
sample: the subset of the population for whom we have data, often randomly selected
We observe samples, but are interested in populations.
descriptive statistics: methods for summarizing the collected data
—> The summaries usually consist of graphs and numbers such as averages and percentages.
A descriptive statistical analysis usually combines graphical and numerical summaries.
Pagina 1
,bar graph —>
inferential statistics: methods of making decisions or predictions about a population, based on
data obtained from a sample of that population
An important aspect of statistical inference involves reporting the likely precision of a prediction.
How close is the sample value likely to be to the true unknown percentage of the population?
In a confidence interval, the range of values above and below the sample statistic is called the
margin of error.
parameter: a numerical summary of the population
statistic: a numerical summary of a sample taken from the population
random sampling: a sample tends to be a good reflection of a population when each subject in
the population has the same chance of being included in that sample
—> random sampling allows us to make powerful inferences about populations
—> randomness is also crucial to performing experiments well
Just as people vary, so do samples vary. With random sampling, the amount of variability from
sample to sample is actually quite predictable.
1.3 Using calculators and computers
To make statistical analysis easier, large sets of data are organized in a data file.
databases: existing archived collections of data files
—> always check sources
applet: a small application program for performing a special task
—> Using an applet, you can take samples from artificial populations and analyze them to
discover properties of statistical methods applied to those samples.
simulation: using a computer to mimic what would actually happen if you selected a sample and
used statistics in real life
2.1 different types of data
variable: any characteristic observed in a study
—> the term variable highlights that data values vary
The data values that we observe for a variable are called observations. Each observation can be a
number such as the number of centimeters of precipitation in a day. Or each observation belongs
to a category, such as yes or no for whether it rained.
Pagina 2
, A variable is called categorical if each observation belongs to one of a set of categories.
—> important: the relative number of observations
- What percentage of students..?
A variable is called quantitative if observations on it take numerical values that represent different
magnitudes of the variable.
—> important: center, variability, spread
- What is a typical amount?
- Is there much variation?
quantity = magnitude = how much
Quantitative variables:
- discrete
- continuous
A quantitative variable is discrete if its possible values from a set of separate numbers.
-> 0, 1, 2, 3
- a finite number of possible values
- ‘’the number of..’’
A quantitative variable is continuous if its possible values form an interval
—> 0,3763765 or 4,56666
- infinite continuum of possible values
- zo precies mogelijk
This is important because the method used to analyze a data set will depend on the type of
variable the data represent.
The category with the highest frequency is called the modal category. For a quantitative variable,
the numerical value that occurs most frequently is the mode.
proportion: the frequency of observations in a category divided by the total number of
observations
percentage: the proportion multiplied by 100
Proportions and percentages are also called relative frequencies and serve as a way to summarize
the measurements in categories of a categorical variable.
Frequency table: a listing of possible values for a variable, together with the number of
observations for each value.
frequency = count
Don’t mistake the frequencies as values of a variable. They are merely a summary of how many
times the observation occurred in each category.
Pagina 3