ӯ yi ŷ s σ μ ± √ μ0 H0 Ha ≠ →
Lecture 1
Week 1: inferential statistics
● How do we draw conclusions about a population from a sample?
● Key concepts: probability, empirical rule, sample, population, sampling
distribution, standard error, confidence interval, central limit theorem,
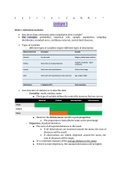
➢ Types of variables
○ different types of variables require different types of description
➢ Core function of statistics is to describe data
○ Centrality: mode, median, mean
■ The type of variable defines the centrality measure that we can use
■ Mean for the dichotomous variable equals proportion
● The proportion is basically the same as the percentage
○ Dispersion: Standard deviation
■ The sum of all squared distances to the mean.
● If all observations are clustered around the mean, the sum of
distances will be small.
● If observations are widely dispersed around the mean, the
sum of distances will be larger.
■ It’s a summary measure of the average distance to the mean.
■ If there is more dispersion, the standard deviations will be higher.
, ➢ Comparing distributions - z-scores
○ z-score: number of standard deviations from the mean
○ z-scores take into account differences in both centrality and dispersion
○ z-scores are a key concept in inferential statistics
○ z-scores help us to describe bell-shaped distributions
■ normal distributions - bell-shaped and symmetrical
Distributions of data
➢ Bell-shaped distributions (perfectly symmetrical around the mean ӯ)
○ we can describe it with empirical rule
○ 68% of all observation within 1 standard deviation from mean (between ӯ-sand ӯ+s)
○ 95,4% of all observations is between 2 standard deviations from mean (between
ӯ-2s and ӯ+2s)
○ 99,7% within 3 standard deviations (between ӯ-3s and ӯ+3s)
➢ we can apply empirical rule to all normal distributions
➢ frequency distributions
○ a listing of possible values for a variable, together with the number of
observations at each value
Probabilities and probability distributions
We can think of frequency distributions as probability distributions as well.
➢ provide probabilities for all the possible outcomes of a variable, lists the possible
outcomes and their probabilities
➢ I pick one random respondent that was sampled:
, ○ What is the probability that he/she/them is older than 20?
○ What is the probability that he/she/them studies more than 20 hours?
➢ We can determine this on the basis of the distribution!
➢ Probability = p
○ The probability is the area under the curve.
○ Each area under a bell-shaped curve can be expressed in a probability p
Standard normal distribution
➢ theoretical distribution used in inferential statistics
○ we use the standard normal distribution for calculations
○ bell-shaped and perfectly symmetrical
○ mean (ӯ) = 0, standard deviation (s) = 1
○ we can apply empirical rule here, too
➢ Probabilities can be defined as z-scores
■ in the standard normal distribution z = yi
➢ Every position in a normal distribution has a z-score with a corresponding probability.
○ Can be found in Table A.
○ For normally distributed variables we can convert z-scores to probabilities
(and the other way around)
Example using the table A
Lecture 1
Week 1: inferential statistics
● How do we draw conclusions about a population from a sample?
● Key concepts: probability, empirical rule, sample, population, sampling
distribution, standard error, confidence interval, central limit theorem,
➢ Types of variables
○ different types of variables require different types of description
➢ Core function of statistics is to describe data
○ Centrality: mode, median, mean
■ The type of variable defines the centrality measure that we can use
■ Mean for the dichotomous variable equals proportion
● The proportion is basically the same as the percentage
○ Dispersion: Standard deviation
■ The sum of all squared distances to the mean.
● If all observations are clustered around the mean, the sum of
distances will be small.
● If observations are widely dispersed around the mean, the
sum of distances will be larger.
■ It’s a summary measure of the average distance to the mean.
■ If there is more dispersion, the standard deviations will be higher.
, ➢ Comparing distributions - z-scores
○ z-score: number of standard deviations from the mean
○ z-scores take into account differences in both centrality and dispersion
○ z-scores are a key concept in inferential statistics
○ z-scores help us to describe bell-shaped distributions
■ normal distributions - bell-shaped and symmetrical
Distributions of data
➢ Bell-shaped distributions (perfectly symmetrical around the mean ӯ)
○ we can describe it with empirical rule
○ 68% of all observation within 1 standard deviation from mean (between ӯ-sand ӯ+s)
○ 95,4% of all observations is between 2 standard deviations from mean (between
ӯ-2s and ӯ+2s)
○ 99,7% within 3 standard deviations (between ӯ-3s and ӯ+3s)
➢ we can apply empirical rule to all normal distributions
➢ frequency distributions
○ a listing of possible values for a variable, together with the number of
observations at each value
Probabilities and probability distributions
We can think of frequency distributions as probability distributions as well.
➢ provide probabilities for all the possible outcomes of a variable, lists the possible
outcomes and their probabilities
➢ I pick one random respondent that was sampled:
, ○ What is the probability that he/she/them is older than 20?
○ What is the probability that he/she/them studies more than 20 hours?
➢ We can determine this on the basis of the distribution!
➢ Probability = p
○ The probability is the area under the curve.
○ Each area under a bell-shaped curve can be expressed in a probability p
Standard normal distribution
➢ theoretical distribution used in inferential statistics
○ we use the standard normal distribution for calculations
○ bell-shaped and perfectly symmetrical
○ mean (ӯ) = 0, standard deviation (s) = 1
○ we can apply empirical rule here, too
➢ Probabilities can be defined as z-scores
■ in the standard normal distribution z = yi
➢ Every position in a normal distribution has a z-score with a corresponding probability.
○ Can be found in Table A.
○ For normally distributed variables we can convert z-scores to probabilities
(and the other way around)
Example using the table A