2. Exploring data with graphs and numerical summaries
2.4. Measuring the variability of quantitative data
Measure of center tells nothing about variability of data numerical sumaries of variability of
distribution
Range = the difference between the largest and the smallest observations
- Only uses the extreme values affected extremely by outliers
- Not resistant
Better numerical summary of variability that uses all the data and describes a typical distance of how
far data falls from the mean summarizing deviations from the mean
The deviation of an observation x from the mean x is (x−x ), the difference between the
observation and the sample mean.
- Each observation has a deviation from the mean
- A deviation (x−x ) is positive when the observation falls above the mean and negative when
the observation falls below the mean.
- Interpretation of the mean as balance point means the positive deviations counterbalance
the negative deviations the sum (and therefore the mean) of the deviations is always
zero
o Because of this, summary measures of variability from the mean use either the
squared deviations or their absolute values
- The average of the squared deviations is called the variance
o Because the variance uses the square of the units of measurement for the original
data, its square root is easier to interpret. This is called the standard deviation.
- Σ ( x −x )2 is called a sum of squares. It represents finding the deviation for each observation,
squaring each deviation and then adding them.
Standard deviation (s) of n observations is:
∑ of squared deviations
s=
√
Σ(x−x)2
n−1
=
√
sample ¿ ¿
This is the square root of the variance s2, which is an average of the squares of the deviations
2 Σ(x−x )2
from their mean: s=
n−1
Interpretation: the standard deviation s represents a typical distance or a type of average
distance from an observation from the mean.
It’s sample size minus -1 because if it’s just 1 then there wouldn’t be deviation at all.
The larger the standard deviation s, the greater the variability of the data.
, Bell shaped distribution the value of s (standard deviation) then has
more valuable interpretation. Using mean & standard deviation alone form intervals that
contain certain percentages (approximately) of the data.
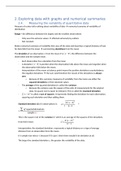
EMPIRICAL RULE: if a distribution of data is bell shaped, then approximately:
- 68% of the observations fall within 1 standard deviation of the mean, that is, between the
values of x−s and x +s , which is x ± s
- 95% of the observations fall within 2 standard deviations of the mean (x ±2 s )
- All or nearly all observations fall within 3 standard deviations of the mean ( x ±3 s)
When the distribution is highly skewed, the most extreme observation in one direction may not be
nearly that far from the mean (doesn’t work because it’s not bell shaped)
The formulas that define x and s refer to sample data, they are sample statistics
Sample statistics vs. population parameters
- Population mean is average of all observations in the population ( μ)
- Population standard deviation describes the variability of the population observations about
the population mean (σ )
- Both of these population parameters usually unknown
2.4. Measuring the variability of quantitative data
Measure of center tells nothing about variability of data numerical sumaries of variability of
distribution
Range = the difference between the largest and the smallest observations
- Only uses the extreme values affected extremely by outliers
- Not resistant
Better numerical summary of variability that uses all the data and describes a typical distance of how
far data falls from the mean summarizing deviations from the mean
The deviation of an observation x from the mean x is (x−x ), the difference between the
observation and the sample mean.
- Each observation has a deviation from the mean
- A deviation (x−x ) is positive when the observation falls above the mean and negative when
the observation falls below the mean.
- Interpretation of the mean as balance point means the positive deviations counterbalance
the negative deviations the sum (and therefore the mean) of the deviations is always
zero
o Because of this, summary measures of variability from the mean use either the
squared deviations or their absolute values
- The average of the squared deviations is called the variance
o Because the variance uses the square of the units of measurement for the original
data, its square root is easier to interpret. This is called the standard deviation.
- Σ ( x −x )2 is called a sum of squares. It represents finding the deviation for each observation,
squaring each deviation and then adding them.
Standard deviation (s) of n observations is:
∑ of squared deviations
s=
√
Σ(x−x)2
n−1
=
√
sample ¿ ¿
This is the square root of the variance s2, which is an average of the squares of the deviations
2 Σ(x−x )2
from their mean: s=
n−1
Interpretation: the standard deviation s represents a typical distance or a type of average
distance from an observation from the mean.
It’s sample size minus -1 because if it’s just 1 then there wouldn’t be deviation at all.
The larger the standard deviation s, the greater the variability of the data.
, Bell shaped distribution the value of s (standard deviation) then has
more valuable interpretation. Using mean & standard deviation alone form intervals that
contain certain percentages (approximately) of the data.
EMPIRICAL RULE: if a distribution of data is bell shaped, then approximately:
- 68% of the observations fall within 1 standard deviation of the mean, that is, between the
values of x−s and x +s , which is x ± s
- 95% of the observations fall within 2 standard deviations of the mean (x ±2 s )
- All or nearly all observations fall within 3 standard deviations of the mean ( x ±3 s)
When the distribution is highly skewed, the most extreme observation in one direction may not be
nearly that far from the mean (doesn’t work because it’s not bell shaped)
The formulas that define x and s refer to sample data, they are sample statistics
Sample statistics vs. population parameters
- Population mean is average of all observations in the population ( μ)
- Population standard deviation describes the variability of the population observations about
the population mean (σ )
- Both of these population parameters usually unknown