3. Association: contingency, correlation and regression
When we analyse data on two variables, our first step is to distinguish between the response
variable and the explanatory variable
The response variable = the outcome variable on which comparisons are made for different values
of the explanatory variable
The explanatory variable = categorical, it defines the groups to be compared with respect to the
response variable. When the explanatory variable is quantitative, we examine how different
values of the explanatory variable relate to changes in the response variable.
The data analysis examines how the outcome on the response variable depends on or is explained
by the value of the explanatory variable.
Some studies regard either or both variables as response variables. There is no clear distinction as to
which variable would be explanatory for the other.
The main purpose of data analysis with two variables is to investigate whether there is an
association and to describe the nature of that association.
An association exists between two variables is particular values for one variable are more likely to
occur with certain values of the other variable.
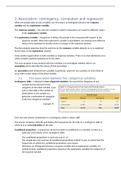
3.1. The association between two categorical variables
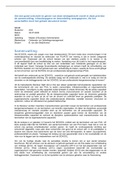
Contingency table = a display for two categorical variables. Its rows list the categories of one
variable and its columns list the
categories of the other variable. Each
entry in the table is the number of
observations in the sample at a
particular combination of categories
of the two categorical variables.
Example
Each row and column combination in a contingency table is called a cell.
The process of taking a data file and finding the frequencies for the cells of a contingency table is
referred to as cross-tabulation of the data.
Conditional proportion = a proportion whose formation is conditional on a variable. It refers to a
particular row/column of the contingency table
- The conditional proportions in each row sum to 1.0
- The sample size n for each set of conditional proportions is listed so you can determine the
frequencies on which the conditional proportions were based.
- Whenever we distinguish between a response variable and an explanatory variable, it is
natural to form conditional proportions (based on the explanatory variable) for categories of
the response variable
, Marginal proportion = the proportion of all the values of a variable. It is found using counts in the
margin of the table. It refers to the sum of the row/column of the contingency table.
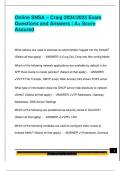
Side-by-side bar chart = a single bar graphs that shows the bars for the conditional proportions side
by side.
Stacked bar chart = a display that compares the conditional proportions by stacking the proportions
on top of each other.
Both the side-by-side bar graph and the stacked bar chart allow an easy comparison of the
conditional proportions across the explanatory variables.
When forming a contingency table, determine whether one variable should be the response
variable. If there is a clear explanatory/response distinction, that dictates which way we compute
the conditional proportions. In some cases, either variable could be the response variable. Then you
can form conditional proportions in either or both directions. Studying the conditional proportions
helps you judge whether there is an association between the variables.
When we analyse data on two variables, our first step is to distinguish between the response
variable and the explanatory variable
The response variable = the outcome variable on which comparisons are made for different values
of the explanatory variable
The explanatory variable = categorical, it defines the groups to be compared with respect to the
response variable. When the explanatory variable is quantitative, we examine how different
values of the explanatory variable relate to changes in the response variable.
The data analysis examines how the outcome on the response variable depends on or is explained
by the value of the explanatory variable.
Some studies regard either or both variables as response variables. There is no clear distinction as to
which variable would be explanatory for the other.
The main purpose of data analysis with two variables is to investigate whether there is an
association and to describe the nature of that association.
An association exists between two variables is particular values for one variable are more likely to
occur with certain values of the other variable.
3.1. The association between two categorical variables
Contingency table = a display for two categorical variables. Its rows list the categories of one
variable and its columns list the
categories of the other variable. Each
entry in the table is the number of
observations in the sample at a
particular combination of categories
of the two categorical variables.
Example
Each row and column combination in a contingency table is called a cell.
The process of taking a data file and finding the frequencies for the cells of a contingency table is
referred to as cross-tabulation of the data.
Conditional proportion = a proportion whose formation is conditional on a variable. It refers to a
particular row/column of the contingency table
- The conditional proportions in each row sum to 1.0
- The sample size n for each set of conditional proportions is listed so you can determine the
frequencies on which the conditional proportions were based.
- Whenever we distinguish between a response variable and an explanatory variable, it is
natural to form conditional proportions (based on the explanatory variable) for categories of
the response variable
, Marginal proportion = the proportion of all the values of a variable. It is found using counts in the
margin of the table. It refers to the sum of the row/column of the contingency table.
Side-by-side bar chart = a single bar graphs that shows the bars for the conditional proportions side
by side.
Stacked bar chart = a display that compares the conditional proportions by stacking the proportions
on top of each other.
Both the side-by-side bar graph and the stacked bar chart allow an easy comparison of the
conditional proportions across the explanatory variables.
When forming a contingency table, determine whether one variable should be the response
variable. If there is a clear explanatory/response distinction, that dictates which way we compute
the conditional proportions. In some cases, either variable could be the response variable. Then you
can form conditional proportions in either or both directions. Studying the conditional proportions
helps you judge whether there is an association between the variables.