Examining Relationships Checkpoint 2 | Acrobatiq Page 1 of 4
Tutoring (/lti_navigation_launch/sl_stats_v1/58eeb3630837637d7a50017a)
BACK TO COURSE (/COURSEWARE/PAGE/SL_STATS_V1/RELATIONSHIPS_CONC)
MODULE EXAMINING RELATIONSHIPS
Step 1 of 1
Question 1 of 7 Points: 0 out of 10
Seat belts are supposed to save lives. Here are the results of a 1988 study of accident records conducted by the Florida State
Department of Highway Safety. The researchers classified people in vehicles involved in accidents as having worn seat belts
or not.
The following two-way table gives the results of the study:
Accident
Nonfatal Fatal Total
Seat Belt? Yes 412,368 510 412,878
No 162,527 1,601 164,128
Total 574,895 2,111 577,006
In this example, it would be appropriate to calculate:
the five-number summary of both variables
the correlation coefficient r
conditional column percentages
conditional row percentages
none of the above
This is not quite right. Remember that to explore a relationship between two categorical variables,
the most appropriate summary is the outcome percentages within each explanatory group. For the
table shown, think about whether the row variable (seat belt) or the column variable (accident) would
be the explanatory variable. (D) is the correct answer.
Question 2 of 7 Points: 10 out of 10
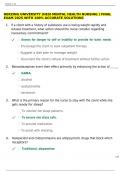
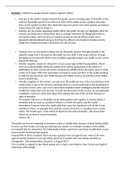
A local ice cream shop kept track of the number of cans of cold soda it sold each day, and the temperature that day, for two
months during the summer. The data are displayed in the scatterplot below:
This study source was downloaded by 100000858936669 from CourseHero.com on 02-04-2023 10:52:50 GMT -06:00
https://straighterline.acrobatiq.com/courseware/summative-assessment/sl_stats_v1/_u2_m2_...
https://www.coursehero.com/file/24825155/Examining-Relationships-Checkpoint-2pdf/ 9/3/2017
Tutoring (/lti_navigation_launch/sl_stats_v1/58eeb3630837637d7a50017a)
BACK TO COURSE (/COURSEWARE/PAGE/SL_STATS_V1/RELATIONSHIPS_CONC)
MODULE EXAMINING RELATIONSHIPS
Step 1 of 1
Question 1 of 7 Points: 0 out of 10
Seat belts are supposed to save lives. Here are the results of a 1988 study of accident records conducted by the Florida State
Department of Highway Safety. The researchers classified people in vehicles involved in accidents as having worn seat belts
or not.
The following two-way table gives the results of the study:
Accident
Nonfatal Fatal Total
Seat Belt? Yes 412,368 510 412,878
No 162,527 1,601 164,128
Total 574,895 2,111 577,006
In this example, it would be appropriate to calculate:
the five-number summary of both variables
the correlation coefficient r
conditional column percentages
conditional row percentages
none of the above
This is not quite right. Remember that to explore a relationship between two categorical variables,
the most appropriate summary is the outcome percentages within each explanatory group. For the
table shown, think about whether the row variable (seat belt) or the column variable (accident) would
be the explanatory variable. (D) is the correct answer.
Question 2 of 7 Points: 10 out of 10
A local ice cream shop kept track of the number of cans of cold soda it sold each day, and the temperature that day, for two
months during the summer. The data are displayed in the scatterplot below:
This study source was downloaded by 100000858936669 from CourseHero.com on 02-04-2023 10:52:50 GMT -06:00
https://straighterline.acrobatiq.com/courseware/summative-assessment/sl_stats_v1/_u2_m2_...
https://www.coursehero.com/file/24825155/Examining-Relationships-Checkpoint-2pdf/ 9/3/2017