Chapter 10: Capital Markets and the Pricing of Risk
10.1 Risk and Return: Insights from 92 Years of Investor History
- As the horizon lengthens, the realtor performance of the stock portfolios improves.
10.2 Common Measures of Risk and Return
● Probability Distributions
○ To make securities comparable their performance is explained in terms of their
returns.
■ The return indicates the percentage increase in the value of an investment
per dollar initially invested in the security.
○ A probability distribution assigns a probability to each possible return.
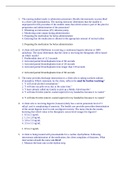
● Expected Return
○ The expected return is calculated as a weighted average of the possible returns
where the weights correspond to the probabilities.
○ The expected return is the return we would earn on average if we could repeat the
investment many times, drawing the return from the same distribution each time.
● Variance and Standard Deviation
○ Variance and standard deviation are measures of the risk of a probability
distribution.
■ Variance is the expected squared deviation from the mean
■ Standard deviation is the square root of the variance
○ If the return is risk-free and never deviates from its mean, the variance is zero.
1
, ○ The standard deviation of a return is its volatility. The standard deviation is easier
to interpret because it is in the same units as the returns themselves.
10. 3 Historical Returns of Stocks and Bonds
● Computing Historical Returns
○ The realized return is the return that actually occurs over a particular time period
○ The realized return is the total return we earn from dividends and capital gains,
expressed as a percentage of the initial stock price.
● Calculating Realized Annual Returns
○ Dividends are immediately reinvested to buy more stocks from the same
company.
● Average Annual Returns
2
10.1 Risk and Return: Insights from 92 Years of Investor History
- As the horizon lengthens, the realtor performance of the stock portfolios improves.
10.2 Common Measures of Risk and Return
● Probability Distributions
○ To make securities comparable their performance is explained in terms of their
returns.
■ The return indicates the percentage increase in the value of an investment
per dollar initially invested in the security.
○ A probability distribution assigns a probability to each possible return.
● Expected Return
○ The expected return is calculated as a weighted average of the possible returns
where the weights correspond to the probabilities.
○ The expected return is the return we would earn on average if we could repeat the
investment many times, drawing the return from the same distribution each time.
● Variance and Standard Deviation
○ Variance and standard deviation are measures of the risk of a probability
distribution.
■ Variance is the expected squared deviation from the mean
■ Standard deviation is the square root of the variance
○ If the return is risk-free and never deviates from its mean, the variance is zero.
1
, ○ The standard deviation of a return is its volatility. The standard deviation is easier
to interpret because it is in the same units as the returns themselves.
10. 3 Historical Returns of Stocks and Bonds
● Computing Historical Returns
○ The realized return is the return that actually occurs over a particular time period
○ The realized return is the total return we earn from dividends and capital gains,
expressed as a percentage of the initial stock price.
● Calculating Realized Annual Returns
○ Dividends are immediately reinvested to buy more stocks from the same
company.
● Average Annual Returns
2