Summary Applied Data Analysis
1. Exploration (L1 / A1)
Generally, research is hypothetical-deductive:
- Formulate hypothesis (on theoretical grounds) and deduce which pattern of results should follow.
- Collect data to test if hypotheses apply
Results in focused-hypothesis ..>...
However, do not limit yourself to that prediction!
- Sometimes, unexpected results are the most interesting ones!
- Almost always, we need to check assumptions of hypothesis tests.
Data analysis: 5 main steps
1. Explore. Look what’s in your data.
2. Check assumptions. Significance tests make assumptions about the data, but do they apply in your
case? (and if violated, what has to be done?)
3. Hypothesis testing. Determine if a predicted relationship exists in the sample (e.g. a correlation
between two variables) and if it can be generalized from sample to population?
4. Interpretation. Analyze the nature of the relationships between variables.
5. Write. Report your results (following APA rules).
(Preliminary step. Decide which technique is most suitable for your research question.)
Exploring frequency distributions
2 basic ways:
1) Make pictures (boxplots, histograms)
2) Compute statistics (mean – median – mode – variance – st. dev. – skewness – kurtosis - K-S)
In our case both (emphasize on normality – normally distributed?)
! Often normality assumption not important, many tests are robust against violation of the
assumption due to large sample size).
SPSS: Analyze – Descriptive stat – Explore (Statistics, Plots)
Histogram: Picture of a frequency distribution ask for normality curve in ‘editing’. (subjective)
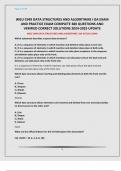
Boxplot: Concise and informative way of presenting a frequency distribution.
Box: 25th – 50th – 75th percentile
(1.5*(box height)) add/subtract from 25th or 75th percentile to get maximum and minimum.
They are illustrated by a ‘stick’. Outside the ‘stick’ are the outliers.
Extreme values are values >3 box heights from the box. They are marked with a *.
Example:
The minimum value is -.25 but the lowest value in the dataset is 0, then your ‘stick’ comes at 0.
Boxplots are based on percentiles, they do not necessarily give the same results as measures based
on means and variances. You could check for signs of asymmetry, based on distance of percentiles
from median.
If the lower stick is equal to the 25th percentile, it means that 25-30% have the lowest possible score.
In such case, there isn’t really a stick.
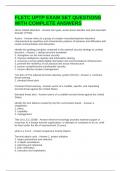
, Various boxplots
Use boxplots to compare different variables, or to compare different groups on same variable.
Boxplots for different variables are only useful when variables have comparable measuring scales.
Mean: the usual average. It is equal to the sum of all the values in the data set divided by the number
of values in the data set.
Median: The middle score (50th percentile) for a set of data that has been arranged in order of
magnitude. The median is less affected by outliers and skewed data. E.g. if you have 2, 4, 6, than 4 is
the median.
Mode: The most frequent score in the data set.
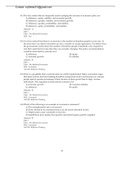
Skewness: measure of asymmetry of the distribution.
• perfect symmetry skewness = 0; (normal distribution)
• long tail of distribution to the right skewness > 0 (positive skewness)
• long tail of distribution to the left skewness < 0 (negative skewness)
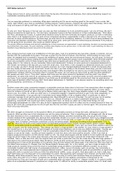
Kurtosis: measure of “peakedness” of a distribution (actually whether a distribution is more or less
“peaked” than you would expect on the basis of the standard deviation and the normality
assumption).
• Perfectly normal distribution kurtosis = 0 (but kurtosis = 0 does not necessarily imply normal
distribution)
• Peak higher than normal kurtosis > 0;
• Peak lower than normal (i.e. distribution to flat) kurtosis < 0.
Hypothesis testing (H0: Sk = 0 or Ku = 0): divide measure of statistic (kurtosis or skewness) by its
standard error. Both given in ‘Descriptives’ table.
Kolmogorov-Smirnov test (K-S test)
Test whether a distribution is significantly different from normality.
When K-S test is highly significant (at least p < .01), no distribution is normal.
! Use with Lilliefors correction.
SPSS: Explore – plots – tick ‘normality plots with tests’.
1. Exploration (L1 / A1)
Generally, research is hypothetical-deductive:
- Formulate hypothesis (on theoretical grounds) and deduce which pattern of results should follow.
- Collect data to test if hypotheses apply
Results in focused-hypothesis ..>...
However, do not limit yourself to that prediction!
- Sometimes, unexpected results are the most interesting ones!
- Almost always, we need to check assumptions of hypothesis tests.
Data analysis: 5 main steps
1. Explore. Look what’s in your data.
2. Check assumptions. Significance tests make assumptions about the data, but do they apply in your
case? (and if violated, what has to be done?)
3. Hypothesis testing. Determine if a predicted relationship exists in the sample (e.g. a correlation
between two variables) and if it can be generalized from sample to population?
4. Interpretation. Analyze the nature of the relationships between variables.
5. Write. Report your results (following APA rules).
(Preliminary step. Decide which technique is most suitable for your research question.)
Exploring frequency distributions
2 basic ways:
1) Make pictures (boxplots, histograms)
2) Compute statistics (mean – median – mode – variance – st. dev. – skewness – kurtosis - K-S)
In our case both (emphasize on normality – normally distributed?)
! Often normality assumption not important, many tests are robust against violation of the
assumption due to large sample size).
SPSS: Analyze – Descriptive stat – Explore (Statistics, Plots)
Histogram: Picture of a frequency distribution ask for normality curve in ‘editing’. (subjective)
Boxplot: Concise and informative way of presenting a frequency distribution.
Box: 25th – 50th – 75th percentile
(1.5*(box height)) add/subtract from 25th or 75th percentile to get maximum and minimum.
They are illustrated by a ‘stick’. Outside the ‘stick’ are the outliers.
Extreme values are values >3 box heights from the box. They are marked with a *.
Example:
The minimum value is -.25 but the lowest value in the dataset is 0, then your ‘stick’ comes at 0.
Boxplots are based on percentiles, they do not necessarily give the same results as measures based
on means and variances. You could check for signs of asymmetry, based on distance of percentiles
from median.
If the lower stick is equal to the 25th percentile, it means that 25-30% have the lowest possible score.
In such case, there isn’t really a stick.
, Various boxplots
Use boxplots to compare different variables, or to compare different groups on same variable.
Boxplots for different variables are only useful when variables have comparable measuring scales.
Mean: the usual average. It is equal to the sum of all the values in the data set divided by the number
of values in the data set.
Median: The middle score (50th percentile) for a set of data that has been arranged in order of
magnitude. The median is less affected by outliers and skewed data. E.g. if you have 2, 4, 6, than 4 is
the median.
Mode: The most frequent score in the data set.
Skewness: measure of asymmetry of the distribution.
• perfect symmetry skewness = 0; (normal distribution)
• long tail of distribution to the right skewness > 0 (positive skewness)
• long tail of distribution to the left skewness < 0 (negative skewness)
Kurtosis: measure of “peakedness” of a distribution (actually whether a distribution is more or less
“peaked” than you would expect on the basis of the standard deviation and the normality
assumption).
• Perfectly normal distribution kurtosis = 0 (but kurtosis = 0 does not necessarily imply normal
distribution)
• Peak higher than normal kurtosis > 0;
• Peak lower than normal (i.e. distribution to flat) kurtosis < 0.
Hypothesis testing (H0: Sk = 0 or Ku = 0): divide measure of statistic (kurtosis or skewness) by its
standard error. Both given in ‘Descriptives’ table.
Kolmogorov-Smirnov test (K-S test)
Test whether a distribution is significantly different from normality.
When K-S test is highly significant (at least p < .01), no distribution is normal.
! Use with Lilliefors correction.
SPSS: Explore – plots – tick ‘normality plots with tests’.