Practical 1: Biomarkers (fluids)
PURPOSE: to process and interpret fictive laboratory patient data in the diagnostic workup
of Alzheimer’s disease.
GOAL: transform raw laboratory data into clinical data using a standard curve & classify
patients according to the AT(N) biomarker profiles.
INSTRUCTIONS:
Calculate CSF concentrations for amyloid-beta 42, tau and phospho-tau
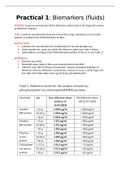
Check whether the values are within the reference values (see Table 1 below)
Label patients according to the AT(N) biomarker profiles of Jack et al. (see Table 1)
APPENDICES:
Raw data (excel file)
Threshold values (table 1) Data were analysed before Feb-2019
Clifford R. Jack, NIA-AA Research Framework: Toward a biological definition of
Alzheimer's disease, Alzheimer's & Dementia, Volume 14, Issue 4, 2018, Pages 535-
562, ISSN 1552-5260, https://doi.org/10.1016/j.jalz.2018.02.018.)
, Presentation:
Done with sandwich ELISA
Then results are diluted in series
These are put in linear graph: Beer’s law plot (the absorbance)
Read concentrations (Raw data excel)
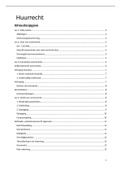
PART 1 – FORMULA
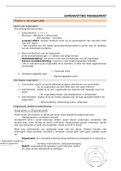
Display the standard dilution series data in a graph and provide the formula
Standard dilution series (AB42 pg/ml)
1.8
1.6
1.4
1.2
Absorbance
1 f(x) = 0.000604733446519525 x − 0.0853115449915111
0.8 R² = 0.685576252473
0.6
0.4
0.2
0
0 500 1000 1500 2000 2500
Concentration
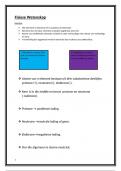
Standard dilution series (t-tau pg/ml)
0.6
0.5
f(x) = 0.000378900675024108 x + 0.100557859209257
0.4
Absorbance
R² = 0.984331549556351
0.3
0.2
0.1
0
0 200 400 600 800 1000 1200
Concentration
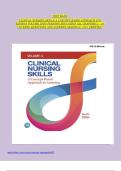
Standard dilution series (p-tau pg/ml)
1.2
f(x) = 0.00872619047619048 x − 0.0758333333333334
1 R² = 0.983440593334505
0.8
Absorbance
0.6
0.4
0.2
0
0 20 40 60 80 100 120 140 160
Concentration
PURPOSE: to process and interpret fictive laboratory patient data in the diagnostic workup
of Alzheimer’s disease.
GOAL: transform raw laboratory data into clinical data using a standard curve & classify
patients according to the AT(N) biomarker profiles.
INSTRUCTIONS:
Calculate CSF concentrations for amyloid-beta 42, tau and phospho-tau
Check whether the values are within the reference values (see Table 1 below)
Label patients according to the AT(N) biomarker profiles of Jack et al. (see Table 1)
APPENDICES:
Raw data (excel file)
Threshold values (table 1) Data were analysed before Feb-2019
Clifford R. Jack, NIA-AA Research Framework: Toward a biological definition of
Alzheimer's disease, Alzheimer's & Dementia, Volume 14, Issue 4, 2018, Pages 535-
562, ISSN 1552-5260, https://doi.org/10.1016/j.jalz.2018.02.018.)
, Presentation:
Done with sandwich ELISA
Then results are diluted in series
These are put in linear graph: Beer’s law plot (the absorbance)
Read concentrations (Raw data excel)
PART 1 – FORMULA
Display the standard dilution series data in a graph and provide the formula
Standard dilution series (AB42 pg/ml)
1.8
1.6
1.4
1.2
Absorbance
1 f(x) = 0.000604733446519525 x − 0.0853115449915111
0.8 R² = 0.685576252473
0.6
0.4
0.2
0
0 500 1000 1500 2000 2500
Concentration
Standard dilution series (t-tau pg/ml)
0.6
0.5
f(x) = 0.000378900675024108 x + 0.100557859209257
0.4
Absorbance
R² = 0.984331549556351
0.3
0.2
0.1
0
0 200 400 600 800 1000 1200
Concentration
Standard dilution series (p-tau pg/ml)
1.2
f(x) = 0.00872619047619048 x − 0.0758333333333334
1 R² = 0.983440593334505
0.8
Absorbance
0.6
0.4
0.2
0
0 20 40 60 80 100 120 140 160
Concentration