Quantitative Data
Analysis 1
Week 1 Data types, exploring your
data QDA1 Lecture 1 (A)
Population and sample
• Population: the complete group of interest - all the values within the whole group
of interest
• Sample: a subset of the population for which observations are gathered (the
observed values)
o *Population > sample
• Random sampling: Each member of the population has equal chance(probability)
to enter the sample
Types of variables
1. Quantitive - measure a number (by nature)
• Continuous: interval (gap) of possible values
o Income (euro)
o Temperature (degrees Celsius)
• Discrete: series of isolated possible values
o Number of cars sold (0, 1, 2, 3, …)
o Change in number of employees (…, -2, -1, 0, 1, 2, …)
> Quantitative variable, remarks:
- no clear division line between discrete and continuous
- usually a continuum lies underneath;
Ex) length: you may think its discrete because it says 1.93m, but it is not
exactly1.93m; 1.930456…
Time: 32.36 mins > continuous variable
- SPSS calls quantitive variables (both continuous and discrete): “scale variable”
- differences have meaning: also called “interval variable”
(Interval: differences have meaning; ratio: ratios also have meaning)
2. Qualitative - measure a
category
• Ordinal: ordered categories
o small, medium or large drink
o job skill {very low, low medium, high, very high}
• Nominal: unordered categories
o Employed/ unemployed
o Brand of a product
Hierarchy in level of information of variables:
1. Continuos
2. Discrete
,3. Ordinal
4. Nominal
, A variable can always be treated as a variable of a lower type
given an ordinal variable (e.g. small/medium/large), you could treat it as:
> nominal by ignoring the ordering
given a discrete variable (e.g. cars sold), you could treat it as:
> ordinal by using ordered categories
> nominal by using categories and ignoring their ordering
* In a survey always go for the highest possible level!
Remarks on Likert variables
Likert variable: used to measure judgement
• A likert scale is a 5 points scale (1-5)
• A likert scale is ordinal not quantitative
o However, in research it is often treated as quantitive. because:
1) It presupposes equal distances between successive categories
2) categories may be consistent with equal distances and a quantitive scale with
numbers is shown in the questionnaire
Exploring data: Qualitative variables
Explore your data to see its characteristics and notice anything relevant
For qualitative variables we use:
• Frequency table
• Bar chart
• Pie chart
• Mode (most frequent outcome)
• Median; only for ordinal (middle outcome) (cumulative percent)
Exploring data: Quantitative variables
• Accounting: liquidity ratio, solvency ratio, profit, turnover, VAT
• Operations: production volume, productivity, delivery time
• Human recourses: # of employees, # of vacancies, training costs
• Marketing: advertising costs, product price
For quantitative variables we use:
• Histogram
• Mode, range
• Mean, standard deviation, Skewness, Kurtosis
• Z-scores
• Percentiles, Quartiles and Box Plots
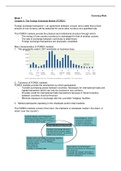
Characteristics of a distribution
• A histogram provides information about the distribution of the values, in terms of: location,
spread, skewness, kurtosis, outliers, special features.
1. Location
• Different locations.
• Location = center
Analysis 1
Week 1 Data types, exploring your
data QDA1 Lecture 1 (A)
Population and sample
• Population: the complete group of interest - all the values within the whole group
of interest
• Sample: a subset of the population for which observations are gathered (the
observed values)
o *Population > sample
• Random sampling: Each member of the population has equal chance(probability)
to enter the sample
Types of variables
1. Quantitive - measure a number (by nature)
• Continuous: interval (gap) of possible values
o Income (euro)
o Temperature (degrees Celsius)
• Discrete: series of isolated possible values
o Number of cars sold (0, 1, 2, 3, …)
o Change in number of employees (…, -2, -1, 0, 1, 2, …)
> Quantitative variable, remarks:
- no clear division line between discrete and continuous
- usually a continuum lies underneath;
Ex) length: you may think its discrete because it says 1.93m, but it is not
exactly1.93m; 1.930456…
Time: 32.36 mins > continuous variable
- SPSS calls quantitive variables (both continuous and discrete): “scale variable”
- differences have meaning: also called “interval variable”
(Interval: differences have meaning; ratio: ratios also have meaning)
2. Qualitative - measure a
category
• Ordinal: ordered categories
o small, medium or large drink
o job skill {very low, low medium, high, very high}
• Nominal: unordered categories
o Employed/ unemployed
o Brand of a product
Hierarchy in level of information of variables:
1. Continuos
2. Discrete
,3. Ordinal
4. Nominal
, A variable can always be treated as a variable of a lower type
given an ordinal variable (e.g. small/medium/large), you could treat it as:
> nominal by ignoring the ordering
given a discrete variable (e.g. cars sold), you could treat it as:
> ordinal by using ordered categories
> nominal by using categories and ignoring their ordering
* In a survey always go for the highest possible level!
Remarks on Likert variables
Likert variable: used to measure judgement
• A likert scale is a 5 points scale (1-5)
• A likert scale is ordinal not quantitative
o However, in research it is often treated as quantitive. because:
1) It presupposes equal distances between successive categories
2) categories may be consistent with equal distances and a quantitive scale with
numbers is shown in the questionnaire
Exploring data: Qualitative variables
Explore your data to see its characteristics and notice anything relevant
For qualitative variables we use:
• Frequency table
• Bar chart
• Pie chart
• Mode (most frequent outcome)
• Median; only for ordinal (middle outcome) (cumulative percent)
Exploring data: Quantitative variables
• Accounting: liquidity ratio, solvency ratio, profit, turnover, VAT
• Operations: production volume, productivity, delivery time
• Human recourses: # of employees, # of vacancies, training costs
• Marketing: advertising costs, product price
For quantitative variables we use:
• Histogram
• Mode, range
• Mean, standard deviation, Skewness, Kurtosis
• Z-scores
• Percentiles, Quartiles and Box Plots
Characteristics of a distribution
• A histogram provides information about the distribution of the values, in terms of: location,
spread, skewness, kurtosis, outliers, special features.
1. Location
• Different locations.
• Location = center