D2
Ratios are calculated to show the organization what financial state they are in and
give them a better understanding of how well the company is performing financially.
Therefore businesses like the way I am doing is Mainwaring engineering, and they
carried out a ratio analysis on a regular basis to monitor the state of the business,
however ratios are not very accurate as they only give an estimate or a predicted
figure so the business has to be careful and not make major decision based on
ratios. In this report I'll evaluate the adequacy of accounting ratios are in terms of
monitoring the state of the business, in this case Mainwaring engineering.
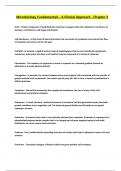
Mainwaring Mainwaring Industry averages
engineering year engineering year for year ending
ending March 2011 ending March 2012 March 2012
Return on capital 7.8% 69/850x100 = 8.1 8%
employed
Gross profit 48% 717/1,628X100 = 40%
percentage 44
Net profit 76% 69/1,628X100 = 75%
percentage 4.2
Stock turnover 92 days 237/911X100 = 95 95 days
Debtor collection 58 days 269/1,628X365 = 55 days
period 60.3
Creditor payment 60 days 212/1190X365 = 57 days
period 65
Current ratio 2.6:1 507/212 = 2.4:1 2.5:1
Acid test 2.5:1 507-237/212 = 1.4:1
1.3:1
Liquidity ratios
The current ratio for Mainwaring engineering in 2012 was 2.4:1, last year it was
2.6:1. Last year the current ratio was good because it is high therefore they had
more chance to save the money, and pay off the debts, but as the year went passed
the current ratio decreased to 2.4:1 and the industry averaged it at 2.5:1 and this is
bad because it went below the business average and this means that the business
will have to sell their liabilities to cover up the debt. In order for the company to
avoid this problem such as not being able to cover short term debt, the company
should reserve some money to be able to pay off the liabilities. The strength of this
current ratio is that in 2011 the result was 2.6:1 which meant that the company had
more money to pay off to the debts, instead of paying it off with the liabilities;
furthermore it has surpassed the industry averages. The other strength is that the
current ratio data will able to show the business if they are able to pay off the short
, term debts. The weakness of this current ratio is that it has decreased from 2.6:1 to
2.4:1 which is bad, as the company averaged the year at 2.5:1, but the business
went below that and this means that it has less money to pay off the debts,
therefore they will need to pay it off with their liabilities.
The acid ratio for Mainwaring engineering in 2012 was 1.3:1, last year it was 1.5:1.
Last year the acid ratio was good because it is high therefore they had more chance
to save the money, and pay off the debts, but as the year went passed the current
ratio decreased to 1.3:1 and the industry averaged it at 1.4:1 and this is bad
because it went below the business average and this means that the business will
have to pay money without selling any stock to cover up the debt. In order for the
company to avoid this problem such as not being able to cover short term debt, the
company should reserve some money to be able to pay off the debt. The strength of
this current ratio is that in 2011 the result was 1.5:1 which meant that the company
had more money to pay off to the debts, instead of paying it off with the liabilities;
furthermore it has surpassed the industry averages. The other strength is that the
acid ratio data will help the company if they will need to pay short term obligations,
so if the ratio is high than the company is stabilized, whereas if it’s low then they
will be more risk and that’s how the liquidity ratio shows the data. The weakness of
this current ratio is that it has decreased from 1.5:1 to 1.3:1 which is bad, as the
company averaged the year at 1.4:1, but the business went below that and this
means that it has less money to pay off the debts, therefore they will need to
reserve more money to pay it off.
Profitability ratios
For return on capital employed, during the year ending of March 2011 the
percentage for it was 7.8%. The next year of the ending of March, the percentage is
8.1% which was good because the industry averaged it at 8%. As you can see the
comparison between the years, in 2011 it was at 7.8% and it has increased next
year to 8.1% which was more than expected and this is excellent job for the
company of Mainwaring engineering. The increase of percentage indicates that the
company’s performance has been better and improved this may be because of
more sales and better efficiency of the business. The strength is that the business
has increased their profit margin from 2011 to 2012, and it has increased by 3
percent which surpassed the industry average by 1 percent and this is a good factor
for the business. The other strength is that ROCE is a useful ratio for comparing
profitability and performances across the companies, and this could be a good
indicator for the head office to make decisions. The weakness is that the previous
year it made 7.8% due to poor performance of the business, but it may decrease in
percentage in 2013 is the business doesn't perform well.
The gross profit percentage for Mainwaring engineering in 2012 was 44%, last year
2011 it was 48%. Last year the gross profit was terrific because of the high
percentage of gross profit and this indicates that the business performance and
Ratios are calculated to show the organization what financial state they are in and
give them a better understanding of how well the company is performing financially.
Therefore businesses like the way I am doing is Mainwaring engineering, and they
carried out a ratio analysis on a regular basis to monitor the state of the business,
however ratios are not very accurate as they only give an estimate or a predicted
figure so the business has to be careful and not make major decision based on
ratios. In this report I'll evaluate the adequacy of accounting ratios are in terms of
monitoring the state of the business, in this case Mainwaring engineering.
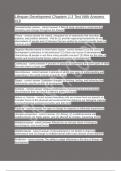
Mainwaring Mainwaring Industry averages
engineering year engineering year for year ending
ending March 2011 ending March 2012 March 2012
Return on capital 7.8% 69/850x100 = 8.1 8%
employed
Gross profit 48% 717/1,628X100 = 40%
percentage 44
Net profit 76% 69/1,628X100 = 75%
percentage 4.2
Stock turnover 92 days 237/911X100 = 95 95 days
Debtor collection 58 days 269/1,628X365 = 55 days
period 60.3
Creditor payment 60 days 212/1190X365 = 57 days
period 65
Current ratio 2.6:1 507/212 = 2.4:1 2.5:1
Acid test 2.5:1 507-237/212 = 1.4:1
1.3:1
Liquidity ratios
The current ratio for Mainwaring engineering in 2012 was 2.4:1, last year it was
2.6:1. Last year the current ratio was good because it is high therefore they had
more chance to save the money, and pay off the debts, but as the year went passed
the current ratio decreased to 2.4:1 and the industry averaged it at 2.5:1 and this is
bad because it went below the business average and this means that the business
will have to sell their liabilities to cover up the debt. In order for the company to
avoid this problem such as not being able to cover short term debt, the company
should reserve some money to be able to pay off the liabilities. The strength of this
current ratio is that in 2011 the result was 2.6:1 which meant that the company had
more money to pay off to the debts, instead of paying it off with the liabilities;
furthermore it has surpassed the industry averages. The other strength is that the
current ratio data will able to show the business if they are able to pay off the short
, term debts. The weakness of this current ratio is that it has decreased from 2.6:1 to
2.4:1 which is bad, as the company averaged the year at 2.5:1, but the business
went below that and this means that it has less money to pay off the debts,
therefore they will need to pay it off with their liabilities.
The acid ratio for Mainwaring engineering in 2012 was 1.3:1, last year it was 1.5:1.
Last year the acid ratio was good because it is high therefore they had more chance
to save the money, and pay off the debts, but as the year went passed the current
ratio decreased to 1.3:1 and the industry averaged it at 1.4:1 and this is bad
because it went below the business average and this means that the business will
have to pay money without selling any stock to cover up the debt. In order for the
company to avoid this problem such as not being able to cover short term debt, the
company should reserve some money to be able to pay off the debt. The strength of
this current ratio is that in 2011 the result was 1.5:1 which meant that the company
had more money to pay off to the debts, instead of paying it off with the liabilities;
furthermore it has surpassed the industry averages. The other strength is that the
acid ratio data will help the company if they will need to pay short term obligations,
so if the ratio is high than the company is stabilized, whereas if it’s low then they
will be more risk and that’s how the liquidity ratio shows the data. The weakness of
this current ratio is that it has decreased from 1.5:1 to 1.3:1 which is bad, as the
company averaged the year at 1.4:1, but the business went below that and this
means that it has less money to pay off the debts, therefore they will need to
reserve more money to pay it off.
Profitability ratios
For return on capital employed, during the year ending of March 2011 the
percentage for it was 7.8%. The next year of the ending of March, the percentage is
8.1% which was good because the industry averaged it at 8%. As you can see the
comparison between the years, in 2011 it was at 7.8% and it has increased next
year to 8.1% which was more than expected and this is excellent job for the
company of Mainwaring engineering. The increase of percentage indicates that the
company’s performance has been better and improved this may be because of
more sales and better efficiency of the business. The strength is that the business
has increased their profit margin from 2011 to 2012, and it has increased by 3
percent which surpassed the industry average by 1 percent and this is a good factor
for the business. The other strength is that ROCE is a useful ratio for comparing
profitability and performances across the companies, and this could be a good
indicator for the head office to make decisions. The weakness is that the previous
year it made 7.8% due to poor performance of the business, but it may decrease in
percentage in 2013 is the business doesn't perform well.
The gross profit percentage for Mainwaring engineering in 2012 was 44%, last year
2011 it was 48%. Last year the gross profit was terrific because of the high
percentage of gross profit and this indicates that the business performance and