Tutorial 11 - Introduction to Statistical Inference
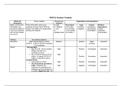
Lecture and Tutorial Learning Goals:
After completing this week's lecture and tutorial work, you will be able to:
Describe real world examples of questions that can be answered with the statistical inference methods.
Name common population parameters (e.g., mean, proportion, median, variance, standard deviation) that are often estimated using sample data, and
use computation to estimate these.
Define the following statistical sampling terms (population, sample, population parameter, point estimate, sampling distribution).
Explain the difference between a population parameter and sample point estimate.
Use computation to draw random samples from a finite population.
Use computation to create a sampling distribution from a finite population.
Describe how sample size influences the sampling distribution.
In [ ]:
### Run this cell before continuing.
library(tidyverse)
library(repr)
library(digest)
library(infer)
options(repr.matrix.max.rows = 6)
source('tests.R')
source('cleanup.R')
Virtual sampling simulation
In this tutorial you will study samples and sample means generated from different distributions. In real life, we rarely, if ever, have measurements for our
entire population. Here, however, we will make simulated datasets so we can understand the behaviour of sample means.
Suppose we had the data science final grades for a large population of students.
In [ ]:
# run this cell to simulate a finite population
set.seed(20201) # DO NOT CHANGE
students_pop <- tibble(grade = (rnorm(mean = 70, sd = 8, n = 10000)))
students_pop
Question 1.0
{points: 1}
Visualize the distribution of the population ( students_pop ) that was just created by plotting a histogram using binwidth = 1 in the
geom_histogram argument. Name the plot pop_dist and give x-axis a descriptive label.
In [ ]:
options(repr.plot.width = 8, repr.plot.height = 6)
# ... <- ggplot(..., ...) +
# geom_...(...) +
# ... +
# ggtitle("Population distribution")
### BEGIN SOLUTION
pop_dist <- ggplot(students_pop, aes(grade)) +
geom_histogram(binwidth = 1) +
xlab("Grades") +
ggtitle("Population distribution") +
theme(text = element_text(size = 20))
### END SOLUTION
pop_dist
In [ ]:
test_1.0()
Question 1.1
{points: 3}
Describe in words the distribution above, comment on the shape, center and how spread out the distribution is.
, BEGIN SOLUTION
The distribution is bell-shaped, symmetric, with one large peak in the middle centered at about 70 percent. Students' scores ranged from just over 40 to
just under 100% but most students got between about 60 to 80%.
END SOLUTION
Question 1.2
{points: 1}
Use summarise to calculate the following population parameters from the students_pop population:
mean (use the mean function)
median (use the median function)
standard deviation (use the sd function)
Name this data frame pop_parameters which has the column names pop_mean , pop_med and pop_sd .
In [ ]:
### BEGIN SOLUTION
pop_parameters <- students_pop %>%
summarise(pop_mean = mean(grade),
pop_med = median(grade),
pop_sd = sd(grade))
### END SOLUTION
pop_parameters
In [ ]:
test_1.2()
Question 1.2.1
{points: 1}
Draw one random sample of 5 students from our population of students ( students_pop ). Use summarize to calculate the mean, median, and
standard deviation for these 5 students.
Name this data frame ests_5 which should have column names mean_5 , med_5 and sd_5 . Use the seed 4321 .
In [ ]:
set.seed(4321) # DO NOT CHANGE!
### BEGIN SOLUTION
ests_5 <- students_pop %>%
rep_sample_n(5) %>%
summarize(mean_5 = mean(grade),
med_5 = median(grade),
sd_5 = sd(grade))
### END SOLUTION
ests_5
In [ ]:
test_1.2.1()
Question 1.2.2 Multiple Choice:
{points: 1}
Which of the following is the point estimate for the average final grade for the population of data science students (rounded to two decimal places)?
A. 70.03
B. 69.76
C. 73.52
D. 8.05
Assign your answer to an object called answer1.2.2 . Your answer should be a single character surrounded by quotes.