DSC1520/2019
Quantitative Modelling 1
DSC1520
Semester 1
Department of Decision Sciences
Assignments
01 (Units 1,2 and 3) 6 March 893111
02 (Units 4 and 5) 29 March 886493
03 (All Units) 23 April 818475
,Assignment 01(S1)
Semester: One Unique Number: 893111 Due Date: 6 March 2019
Question 1
Find the equation of the line passing through the points (3; 1) and 4; 2.
3
−3 14
[1] y= x+
5 5
−3
[2] y= 5
x +1
[3] y =x+ 14
5
[4] y = −53 x − 145
[5] None of the above.
Question 2
The daily rate of sales of a product (in units per day) is approximated by the exponential equation
S(t) = 1 800 + 1 500e−0,3t+1,5,
with t the number of days it has been on the market. After how many days, rounded to a whole
number, will the rate of sale be 2 000 units per day?
[1] 4
[2] 7
[3] 11
[4] 12
[5] None of the above.
Question 3
If the demand function is P = 80 − 0,5Q where P and Q are the price and quantity respectively,
determine the expression for price elasticity of demand in terms of P only.
P − 80
[1]
P
P
[2]
P − 80
P
[3]
P − 1 600
1 600
[4]
P − 80
[5] None of the above.
2
, DSC1520
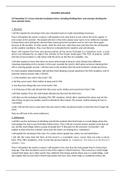
Questions 4 and 5 are based on the following information: Consider the market defined by
the following demand and supply functions, Pd = 50 − 0,6Q and Ps = 20 + 0,4Q where P and Q are
the price and quantity respectively. The following graph represents these functions.
P
P
Question 4
The coordinates of the intercept are
[1] (32; 30).
[2] (30; 32).
[3] (68; 30).
[4] (8; 70).
[5] none of the above.
Question 5
At the intercept
[1] 30 or 32 units are produced to break even
[2] equilibrium is reached when 30 units are produced at R32 per unit
[3] consumer surplus is 68 and producer surplus is 30
[4] Point elasticity of demand is 8 and arc elasticity of demand is 70
[5] None of the above.
3
Quantitative Modelling 1
DSC1520
Semester 1
Department of Decision Sciences
Assignments
01 (Units 1,2 and 3) 6 March 893111
02 (Units 4 and 5) 29 March 886493
03 (All Units) 23 April 818475
,Assignment 01(S1)
Semester: One Unique Number: 893111 Due Date: 6 March 2019
Question 1
Find the equation of the line passing through the points (3; 1) and 4; 2.
3
−3 14
[1] y= x+
5 5
−3
[2] y= 5
x +1
[3] y =x+ 14
5
[4] y = −53 x − 145
[5] None of the above.
Question 2
The daily rate of sales of a product (in units per day) is approximated by the exponential equation
S(t) = 1 800 + 1 500e−0,3t+1,5,
with t the number of days it has been on the market. After how many days, rounded to a whole
number, will the rate of sale be 2 000 units per day?
[1] 4
[2] 7
[3] 11
[4] 12
[5] None of the above.
Question 3
If the demand function is P = 80 − 0,5Q where P and Q are the price and quantity respectively,
determine the expression for price elasticity of demand in terms of P only.
P − 80
[1]
P
P
[2]
P − 80
P
[3]
P − 1 600
1 600
[4]
P − 80
[5] None of the above.
2
, DSC1520
Questions 4 and 5 are based on the following information: Consider the market defined by
the following demand and supply functions, Pd = 50 − 0,6Q and Ps = 20 + 0,4Q where P and Q are
the price and quantity respectively. The following graph represents these functions.
P
P
Question 4
The coordinates of the intercept are
[1] (32; 30).
[2] (30; 32).
[3] (68; 30).
[4] (8; 70).
[5] none of the above.
Question 5
At the intercept
[1] 30 or 32 units are produced to break even
[2] equilibrium is reached when 30 units are produced at R32 per unit
[3] consumer surplus is 68 and producer surplus is 30
[4] Point elasticity of demand is 8 and arc elasticity of demand is 70
[5] None of the above.
3