Intro to Research in Marketing
Defining Multivariate Analysis: ‘Broadly speaking, it refers to all statistical
methods that simultaneously analyze multiple measurements on each
individual or object under investigation’
(Multivariate = more than 2 variables)
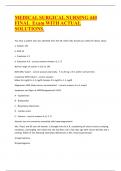
Measurement Scale
Nominal Unique definition/ Brand name/ gender
classification
Ordinal Order/ ranking Level of education
Interval Arbitrary origin IQ, time of day
Ratio A clear starting point Height, Age, Cost
Errors:
- Reliability: Is the measure ,consistent’, correctly geregistered, ..?
- Validity: Does the measure capture the concept it is supposed to
measure?
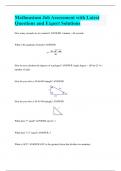
Reality
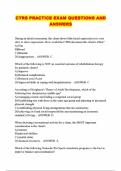
Hypothesis Testing
H0: no
Ha: difference
difference
H0: no
β (type II error)
Statistical
1-α
decision
difference
Ha: difference α (type I error) 1-β (power)
- Type I error () = probability of test showing statistical significance when
it is not present (‘false positive’)
- Power (1-) = probability of test showing statistical significance when it is
present
,Dependence techniques: one outcome variable
ANOVA → marketing mix effectiveness
- How does visit frequency (once or twice a year) and use of
samples (yes/no) affect physicians’ prescriptions?
Logistic regression → targeting & marketing mix effectiveness
- Does improved waiting time at the checkout increase the
likelihood of visiting a store?
- What is the probability that a person will respond to a direct
mailing based on opening speed (in hours) after receiving the
mail?
Conjoint analysis → product development research
- To what extent does each attribute (factor) contribute to the
total utility of a product?
- What are the optimal features for a new type of sneakers?
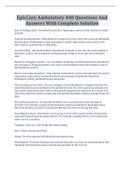
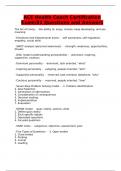
Dependent variable Independent variables Method
(outcome) (explanatory)
Metric Non-Metric (Nominal) ANOVA
Non-Metric (0 or 1; Metric (Or dummies) Logistic Regression
probability)
Metric (Utility score) Non-Metric (Attributes) Conjoint Analysis
Interdependence techniques: no specific outcome variable, whole set of
interdependent relationships is examined
Factor analysis → group variables (mostly as auxiliary method)
- Which two product characteristics, out of multiple product
attributes, should we communicate?
Cluster analysis → group objects: segmentation
- Which client groups can company X distinguish based on
product usage?
- What products can be recommended to online users based on
previous clicks and purchases?
Multidimensional scaling → positioning/perceptual map
- How is product X perceived compared to other products?
- -Which are the closest competitors of a new brand of product Y?
What are outliers?
Outliers = “Observations with a unique combination of characteristics
identifiable as distinctly different from the other observations” (unusual
observations)
There are two basic types of outliers:
- ‘good’: true value (probably), this can give a lot of information
- ‘bad’: wrong recorded data has negative influence on results
To distinguish these types, one should investigate the causes
- Procedural error
- Exceptional circumstances (cause known or unknown)
, - ‘Regular’ levels, yet unique in combination with other variables
(bivariate en multivariate outliers)
Why worry? Bad outliers completely mess up the results!
How can we detect outliers?
• Univariate (Histograms, Frequency Tables, Mean +/- 3SD, Box Plots)
• Bivariate (Scatterplot, Multiple Histograms)
• Multivariate (Mahalanobis D2) (NOT IN THIS COURSE)
Keep or delete? → “Judgement Call”
• Only observations that truly deviate can be considered outliers.
• Removing many ‘outliers’ can jeopardize representativeness
Examining Missing Data
Missing Value Analysis option in SPSS. Missing data = some data is not present
for different persons or periods. Smaller sample size decrease in power.
Why bother? Missing data lead to
• Reduced sample size
• Possibly biased outcomes if missing data process not random
4-step approach for identification and remedying
Steps in Missing Data Analysis:
1. Determine type of missing data:
Ignorable Non-ignorable Missings?
2. Determine Extent (%) of missing data:
By variable, case, overall
3. Diagnose randomness of missing data:
Systematic, Missing At Random (MAR), Missing Completely At Random
(MCAR)?
4. Deal with the missing data problem:
Remove Cases or variables with missing values, Use Imputation (replace
it by the means of other respondents).
Missing data is ignorable when they are built in (people with no kids can’t
answer the question about the age of their children). Less than 10% missing
data move on.
Step 3: Diagnose the randomness of missing data. Are Non-ignorable missings:
• ‘Systematic’
Linked to level of variable itself, other pattern?
• Missing At Random (MAR)
Whether Y is missing depends on level of X. Yet, within level of X: missing
at random
• Missing Completely At Random (MCAR)
Whether Y is missing is truly ‘random’ (independent of Y or of any other
variable X). There is no link between changes consumers give. No limit
whether an answer is given or not and what it would be. Positive
because it doesn’t influence results.
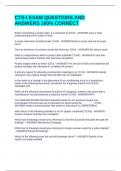
, ANOVA
Step 1 | Defining the objectives
Step 2 | Designing the AN(C)OVA
Step 3 | Checking assumptions
Step 4 | Estimating the model
Step 5 | Interpreting the results
Step 6 | Validating the outcomes
Step 7 | Using the results
Step 1: Defining the objectives
Test whether treatments (categorical variables) lead to different levels for a
(set of) metric outcome variables, e.g.
• Does online ad design, in particular: position of picture and logo, affect
the click-through rate?
• How does visit frequency (once or twice a year) and use of samples
(yes\no) affect physicians’ prescriptions?
• How does promo activity affect store sales and traffic?
Treatments = variables that will affect the results (Independent Variables)
The explanatory variables (Independent Variables) are always nominal (or
ordinal) scaled.
The outcome variable is always one variable (1 Dependent Variable)
The measurement scale for the outcome variable (Dependent Variable)
need to be metric (interval or ratio)
Why use ANOVA and not multiple T-tests?
• 1 test, =.05:
Probability of decision=‘effect’ while there is none: .05
Probability of decision=‘no effect’ while there is none: .95
• 3 tests, =.05 in each test:
Probability of decision=‘no effect’ in each test, while there is none:
(.95)3=.857
Probability of decision=‘effect’ in at least one of the three tests, while
there is none: (1-.857)=.143>.05!!!
• Result = Probability of erroneously finding effect increases with number
of tests
Defining Multivariate Analysis: ‘Broadly speaking, it refers to all statistical
methods that simultaneously analyze multiple measurements on each
individual or object under investigation’
(Multivariate = more than 2 variables)
Measurement Scale
Nominal Unique definition/ Brand name/ gender
classification
Ordinal Order/ ranking Level of education
Interval Arbitrary origin IQ, time of day
Ratio A clear starting point Height, Age, Cost
Errors:
- Reliability: Is the measure ,consistent’, correctly geregistered, ..?
- Validity: Does the measure capture the concept it is supposed to
measure?
Reality
Hypothesis Testing
H0: no
Ha: difference
difference
H0: no
β (type II error)
Statistical
1-α
decision
difference
Ha: difference α (type I error) 1-β (power)
- Type I error () = probability of test showing statistical significance when
it is not present (‘false positive’)
- Power (1-) = probability of test showing statistical significance when it is
present
,Dependence techniques: one outcome variable
ANOVA → marketing mix effectiveness
- How does visit frequency (once or twice a year) and use of
samples (yes/no) affect physicians’ prescriptions?
Logistic regression → targeting & marketing mix effectiveness
- Does improved waiting time at the checkout increase the
likelihood of visiting a store?
- What is the probability that a person will respond to a direct
mailing based on opening speed (in hours) after receiving the
mail?
Conjoint analysis → product development research
- To what extent does each attribute (factor) contribute to the
total utility of a product?
- What are the optimal features for a new type of sneakers?
Dependent variable Independent variables Method
(outcome) (explanatory)
Metric Non-Metric (Nominal) ANOVA
Non-Metric (0 or 1; Metric (Or dummies) Logistic Regression
probability)
Metric (Utility score) Non-Metric (Attributes) Conjoint Analysis
Interdependence techniques: no specific outcome variable, whole set of
interdependent relationships is examined
Factor analysis → group variables (mostly as auxiliary method)
- Which two product characteristics, out of multiple product
attributes, should we communicate?
Cluster analysis → group objects: segmentation
- Which client groups can company X distinguish based on
product usage?
- What products can be recommended to online users based on
previous clicks and purchases?
Multidimensional scaling → positioning/perceptual map
- How is product X perceived compared to other products?
- -Which are the closest competitors of a new brand of product Y?
What are outliers?
Outliers = “Observations with a unique combination of characteristics
identifiable as distinctly different from the other observations” (unusual
observations)
There are two basic types of outliers:
- ‘good’: true value (probably), this can give a lot of information
- ‘bad’: wrong recorded data has negative influence on results
To distinguish these types, one should investigate the causes
- Procedural error
- Exceptional circumstances (cause known or unknown)
, - ‘Regular’ levels, yet unique in combination with other variables
(bivariate en multivariate outliers)
Why worry? Bad outliers completely mess up the results!
How can we detect outliers?
• Univariate (Histograms, Frequency Tables, Mean +/- 3SD, Box Plots)
• Bivariate (Scatterplot, Multiple Histograms)
• Multivariate (Mahalanobis D2) (NOT IN THIS COURSE)
Keep or delete? → “Judgement Call”
• Only observations that truly deviate can be considered outliers.
• Removing many ‘outliers’ can jeopardize representativeness
Examining Missing Data
Missing Value Analysis option in SPSS. Missing data = some data is not present
for different persons or periods. Smaller sample size decrease in power.
Why bother? Missing data lead to
• Reduced sample size
• Possibly biased outcomes if missing data process not random
4-step approach for identification and remedying
Steps in Missing Data Analysis:
1. Determine type of missing data:
Ignorable Non-ignorable Missings?
2. Determine Extent (%) of missing data:
By variable, case, overall
3. Diagnose randomness of missing data:
Systematic, Missing At Random (MAR), Missing Completely At Random
(MCAR)?
4. Deal with the missing data problem:
Remove Cases or variables with missing values, Use Imputation (replace
it by the means of other respondents).
Missing data is ignorable when they are built in (people with no kids can’t
answer the question about the age of their children). Less than 10% missing
data move on.
Step 3: Diagnose the randomness of missing data. Are Non-ignorable missings:
• ‘Systematic’
Linked to level of variable itself, other pattern?
• Missing At Random (MAR)
Whether Y is missing depends on level of X. Yet, within level of X: missing
at random
• Missing Completely At Random (MCAR)
Whether Y is missing is truly ‘random’ (independent of Y or of any other
variable X). There is no link between changes consumers give. No limit
whether an answer is given or not and what it would be. Positive
because it doesn’t influence results.
, ANOVA
Step 1 | Defining the objectives
Step 2 | Designing the AN(C)OVA
Step 3 | Checking assumptions
Step 4 | Estimating the model
Step 5 | Interpreting the results
Step 6 | Validating the outcomes
Step 7 | Using the results
Step 1: Defining the objectives
Test whether treatments (categorical variables) lead to different levels for a
(set of) metric outcome variables, e.g.
• Does online ad design, in particular: position of picture and logo, affect
the click-through rate?
• How does visit frequency (once or twice a year) and use of samples
(yes\no) affect physicians’ prescriptions?
• How does promo activity affect store sales and traffic?
Treatments = variables that will affect the results (Independent Variables)
The explanatory variables (Independent Variables) are always nominal (or
ordinal) scaled.
The outcome variable is always one variable (1 Dependent Variable)
The measurement scale for the outcome variable (Dependent Variable)
need to be metric (interval or ratio)
Why use ANOVA and not multiple T-tests?
• 1 test, =.05:
Probability of decision=‘effect’ while there is none: .05
Probability of decision=‘no effect’ while there is none: .95
• 3 tests, =.05 in each test:
Probability of decision=‘no effect’ in each test, while there is none:
(.95)3=.857
Probability of decision=‘effect’ in at least one of the three tests, while
there is none: (1-.857)=.143>.05!!!
• Result = Probability of erroneously finding effect increases with number
of tests