Chapter 1 – Introduction to Biostatistics
Chapter Exercises
1.4.1. – 1.4.4. Answers will vary
Review Exercises
1. Descriptive statistics are used to describe a set of data, including such summary
measures as the mean.
2. Inferential statistics are used to infer or predict information about a population based
on data collected from a sample.
3. (a) – (l) These terms are defined in Section 1.2 of the text; (m) – (o) These terms are
defined in Section 1.4 of the text.
4. The term measurement refers to the assignment of numbers to objects or events using
a set of predefined rules.
5. The measurement scales are, in order of lowest to highest level: nominal, ordinal,
interval, and ratio. The nominal scale is simply the naming of observations, and is
used to describe categories of data. The ordinal scale is used to describe data that are
ranked in a given order. The interval scale refers to data in which the distance
between any two measurements is a known and measurable quantity, but where there
is an arbitrary zero point on the scale of measurement. The ratio scale refers to data
in which the ratio, as well as the distance, among measurements is known and
measurable, and where there is a non-arbitrary zero point.
6. (a) quantitative, ordinal
(b) qualitative, nominal
(c) quantitative, ratio
(d) qualitative, nominal
(e) quantitative, interval (“zero degrees” of motion varies by instrumentation)
(f) quantitative, interval
7. Situation A.
(a) 300 households (b) all households in the small southern town
(c) number of school-aged children present (d) number of households that reported one
or more children (e) nominal (categories: 0 children, 1 child, and so on)
3
,Situation B.
(a) 250 patients (b) all patients admitted to the hospital during the past year
(c) distance patient lives from the hospital (d) 250 distances
(e) ratio
8. Situation A – (example answer) – stratify the town according to neighborhood size
and then sample proportional to size of the neighborhood to achieve 300 households
Situation B – (example answer) – determine the total number of patient files available,
randomly select a starting point within the filing system holding patient records, and
select the 5th, 10th, 15th, etc. file until you reach 250 (the number of the file one chooses is
based on the number that are available, per the example in the text).
4
, Chapter 2 – Descriptive Statistics
Chapter Exercises
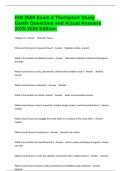
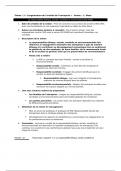
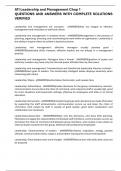
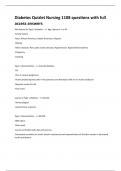
2.3.1. (a)
Cumulative
Class Cumulative Relative relative
interval Frequency frequency frequency frequency
0-0.49 3 3 3.33 3.33
.5-0.99 3 6 3.33 6.67
1.0-1.49 15 21 16.67 23.33
1.5-1.99 15 36 16.67 40.0
2.0-2.49 45 81 50.0 90.00
2.5-2.99 9 90 10.0 100.0
Histogram of pindex
50
40
30
Frequency
20
10
0
0.25 0.75 1.25 1.75 2.25 2.75
pindex
Frequency Polygon of pindex
50
40
30
Frequency
20
10
0
0.25 0.75 1.25 1.75 2.25 2.75 3.25
pindex
5
, (b) 40.0 % (c) 23/30 = .7667 (d) 16.67 % (e) 9 (f) 1/6 = .1667
(g) 2.17, because it composes almost 25 percent of the data and is the most frequently
occurring value in the data set
(h) Skewed to the left
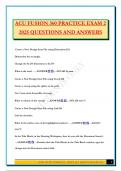
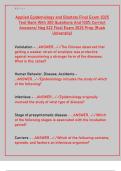
2.3.2. (a)
Cumulative
Class Cumulative Relative relative
interval Frequency frequency frequency frequency
0-4.9 29 29 18.24 18.24
5-9.9 86 115 54.09 72.33
10-14.9 25 140 15.72 88.05
15-19.9 12 152 7.55 95.60
20-24.9 3 155 1.89 97.48
25-29.9 2 157 1.26 98.74
30-34.9 2 159 1.26 100.00
Histogram of sizes
90
80
70
60
Frequency
50
40
30
20
10
0
2.5 7.5 12.5 17.5 22.5 27.5 32.5
sizes
6
Chapter Exercises
1.4.1. – 1.4.4. Answers will vary
Review Exercises
1. Descriptive statistics are used to describe a set of data, including such summary
measures as the mean.
2. Inferential statistics are used to infer or predict information about a population based
on data collected from a sample.
3. (a) – (l) These terms are defined in Section 1.2 of the text; (m) – (o) These terms are
defined in Section 1.4 of the text.
4. The term measurement refers to the assignment of numbers to objects or events using
a set of predefined rules.
5. The measurement scales are, in order of lowest to highest level: nominal, ordinal,
interval, and ratio. The nominal scale is simply the naming of observations, and is
used to describe categories of data. The ordinal scale is used to describe data that are
ranked in a given order. The interval scale refers to data in which the distance
between any two measurements is a known and measurable quantity, but where there
is an arbitrary zero point on the scale of measurement. The ratio scale refers to data
in which the ratio, as well as the distance, among measurements is known and
measurable, and where there is a non-arbitrary zero point.
6. (a) quantitative, ordinal
(b) qualitative, nominal
(c) quantitative, ratio
(d) qualitative, nominal
(e) quantitative, interval (“zero degrees” of motion varies by instrumentation)
(f) quantitative, interval
7. Situation A.
(a) 300 households (b) all households in the small southern town
(c) number of school-aged children present (d) number of households that reported one
or more children (e) nominal (categories: 0 children, 1 child, and so on)
3
,Situation B.
(a) 250 patients (b) all patients admitted to the hospital during the past year
(c) distance patient lives from the hospital (d) 250 distances
(e) ratio
8. Situation A – (example answer) – stratify the town according to neighborhood size
and then sample proportional to size of the neighborhood to achieve 300 households
Situation B – (example answer) – determine the total number of patient files available,
randomly select a starting point within the filing system holding patient records, and
select the 5th, 10th, 15th, etc. file until you reach 250 (the number of the file one chooses is
based on the number that are available, per the example in the text).
4
, Chapter 2 – Descriptive Statistics
Chapter Exercises
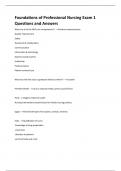
2.3.1. (a)
Cumulative
Class Cumulative Relative relative
interval Frequency frequency frequency frequency
0-0.49 3 3 3.33 3.33
.5-0.99 3 6 3.33 6.67
1.0-1.49 15 21 16.67 23.33
1.5-1.99 15 36 16.67 40.0
2.0-2.49 45 81 50.0 90.00
2.5-2.99 9 90 10.0 100.0
Histogram of pindex
50
40
30
Frequency
20
10
0
0.25 0.75 1.25 1.75 2.25 2.75
pindex
Frequency Polygon of pindex
50
40
30
Frequency
20
10
0
0.25 0.75 1.25 1.75 2.25 2.75 3.25
pindex
5
, (b) 40.0 % (c) 23/30 = .7667 (d) 16.67 % (e) 9 (f) 1/6 = .1667
(g) 2.17, because it composes almost 25 percent of the data and is the most frequently
occurring value in the data set
(h) Skewed to the left
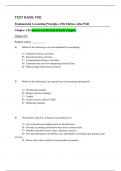
2.3.2. (a)
Cumulative
Class Cumulative Relative relative
interval Frequency frequency frequency frequency
0-4.9 29 29 18.24 18.24
5-9.9 86 115 54.09 72.33
10-14.9 25 140 15.72 88.05
15-19.9 12 152 7.55 95.60
20-24.9 3 155 1.89 97.48
25-29.9 2 157 1.26 98.74
30-34.9 2 159 1.26 100.00
Histogram of sizes
90
80
70
60
Frequency
50
40
30
20
10
0
2.5 7.5 12.5 17.5 22.5 27.5 32.5
sizes
6