Week 3: General Linear Model
Ch 12: Comparing Several Independent Means
Using a Linear Model to Compare Several Means
Advantages of the linear model framework:
1) The linear model extends logically to the more complex situations – e.g., multiple
predictors, unequal group sizes
2) SPSS uses the linear model framework (i.e., the general linear model) for comparing
means
The general equation is used again => 𝑜𝑢𝑡𝑐𝑜𝑚𝑒𝑖 = (𝑚𝑜𝑑𝑒𝑙) + 𝑒𝑟𝑟𝑜𝑟𝑖
1. ‘Model’ in the equation => replaced with one dummy variable that codes two groups
(i.e., 0 for one group, and 1 for the other)
- And an associated b-value => representing the difference between the group
means
Any number of groups can be included => by extending the number of dummy variables to
one less than the number of groups
- That one less group => i.e., the baseline category; assigned a 0 code on all
dummy variables
The baseline category => the condition against which the other groups are being compared
• In most experiments => this would be the control group
• In designs with unequal group sizes => important that the baseline category contains
a large number of cases
- Ensures that the estimates of b-values are reliable
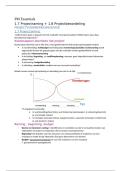
𝑜𝑢𝑡𝑐𝑜𝑚𝑒𝑖 = 𝑏0 + 𝑏1 𝑔𝑟𝑜𝑢𝑝1 + 𝑏2 𝑔𝑟𝑜𝑢𝑝2 + 𝜀𝑖
,Using a coding scheme => allows for each
group to be uniquely expressed by the
combined values for the dummy variables
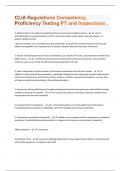
When predicting an outcome from group membership => the predicted values from the model
are the group means
The colorized horizontal lines => represent the mean
outcome of each group
The shapes => represent the outcome of individual
participants (different shapes => different
experimental groups)
The red horizontal line => the average outcome of all
participants
The model for the control group – in which all dummies are coded 0 – becomes:
𝑜𝑢𝑡𝑐𝑜𝑚𝑒𝑖 = 𝑏0 + (𝑏1 × 0) + (𝑏2 × 0)
Therefore, the bo in the model => always the mean of the baseline category
For someone in group 1 – the value of the dummy variable for group 1 will be coded 1 and the
value for group 2 will be coded 0 – becoming:
𝑜𝑢𝑡𝑐𝑜𝑚𝑒𝑖 = 𝑏0 + (𝑏1 × 1) + (𝑏2 × 0)
This shows that the predicted outcome for someone in group 1 => the sum of bo and the b for
the dummy variable for group 1 (= b1)
Therefore, the mean of the control group = bo and the predicted outcome for someone in group
1 = the mean of that group
• We can replace bo and outcome with:
𝑋̅𝑔𝑟𝑜𝑢𝑝1 = 𝑋̅𝑐𝑜𝑛𝑡𝑟𝑜𝑙 + 𝑏1
𝑏1 = ̅𝑋𝑔𝑟𝑜𝑢𝑝1 − 𝑋̅𝑐𝑜𝑛𝑡𝑟𝑜𝑙
, • Shows that the b-value for the dummy variable representing group 1 => is the difference
between the means of that group and the control
Similarly => for group 2 the equation becomes:
𝑜𝑢𝑡𝑐𝑜𝑚𝑒𝑖 = 𝑏0 + (𝑏1 × 0) + (𝑏2 × 1)
𝑜𝑢𝑡𝑐𝑜𝑚𝑒𝑖 = 𝑏0 + 𝑏2
By replacing the variables => we can see that the b-value for group 2 represents the difference
between the means for that group and the control:
𝑋̅𝑔𝑟𝑜𝑢𝑝2 = 𝑋̅𝑐𝑜𝑛𝑡𝑟𝑜𝑙 + 𝑏2
𝑏2 = ̅𝑋𝑔𝑟𝑜𝑢𝑝2 − 𝑋̅𝑐𝑜𝑛𝑡𝑟𝑜𝑙
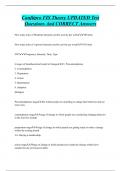
The output shows that the model fit was tested
with an F-statistic => which is significant
- The model represents the group means =>
this F tells us that using group means to
predict outcome scores is sig better than using
the mean of all scores
- i.e., the group means are sig different
The F-test is an overall test – and does not identify the differences between specific means
• The model parameters (b-values) do identify these differences
- The constant bo => the mean of the baseline group
- The b1 => the difference between the means of group 1 and the baseline group
- The b2 => the difference between the means of group 2 and the baseline group
Using the significance values of the associated t-tests => see that the difference between group
1 and control group (= b1) is significant at p = .008
- But the difference b/n group 2 and the control is not sig at p = .282
Logic of the F-Statistic
, The F-statistic => tests the overall fit of a linear model to a set of observed data
• It is the ratio of how good the model is – compared to how bad it is (error)
When the model is based on group means => the predictions from the model are those means
• If the group means are the same => ability to predict the observed data will be poor
(small F)
• If the means differ => able to better discriminate between cases from different groups
(large F)
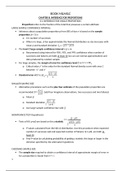
In this context => F tells us whether the group means are significantly different
If the Ho: group means are equal => is true
- Then the b coefficients would all be 0 => because if the group means are equal
– then the difference between them will be 0
Mini Summary
• The model that represents ‘no effect’ or ‘no relationship b/n predictor variable and
outcome’ => one where the predicted value of the outcome is always the grand mean
- i.e., the mean of the outcome variable
• A different model can be fit to the data that represents the Ha
• The fit of the Ha model can be compared to the fit of the Ho model => i.e., using the
grand mean
• The intercept (bo) and one or more parameters (b) => describe the model
• The parameters determine the shape of the model fitted
- The bigger the coefficients => the greater the deviation b/n model and Ho model
(grand mean)
• In experimental research => the b parameters represent the differences b/n group means
- The bigger the differences b/n group means => the greater the difference b/n
model and the Ho model (grand mean)
• If the differences b/n group sizes are large enough => the resulting model will be a
better fit to the data than the Ho model (grand mean)
Ch 12: Comparing Several Independent Means
Using a Linear Model to Compare Several Means
Advantages of the linear model framework:
1) The linear model extends logically to the more complex situations – e.g., multiple
predictors, unequal group sizes
2) SPSS uses the linear model framework (i.e., the general linear model) for comparing
means
The general equation is used again => 𝑜𝑢𝑡𝑐𝑜𝑚𝑒𝑖 = (𝑚𝑜𝑑𝑒𝑙) + 𝑒𝑟𝑟𝑜𝑟𝑖
1. ‘Model’ in the equation => replaced with one dummy variable that codes two groups
(i.e., 0 for one group, and 1 for the other)
- And an associated b-value => representing the difference between the group
means
Any number of groups can be included => by extending the number of dummy variables to
one less than the number of groups
- That one less group => i.e., the baseline category; assigned a 0 code on all
dummy variables
The baseline category => the condition against which the other groups are being compared
• In most experiments => this would be the control group
• In designs with unequal group sizes => important that the baseline category contains
a large number of cases
- Ensures that the estimates of b-values are reliable
𝑜𝑢𝑡𝑐𝑜𝑚𝑒𝑖 = 𝑏0 + 𝑏1 𝑔𝑟𝑜𝑢𝑝1 + 𝑏2 𝑔𝑟𝑜𝑢𝑝2 + 𝜀𝑖
,Using a coding scheme => allows for each
group to be uniquely expressed by the
combined values for the dummy variables
When predicting an outcome from group membership => the predicted values from the model
are the group means
The colorized horizontal lines => represent the mean
outcome of each group
The shapes => represent the outcome of individual
participants (different shapes => different
experimental groups)
The red horizontal line => the average outcome of all
participants
The model for the control group – in which all dummies are coded 0 – becomes:
𝑜𝑢𝑡𝑐𝑜𝑚𝑒𝑖 = 𝑏0 + (𝑏1 × 0) + (𝑏2 × 0)
Therefore, the bo in the model => always the mean of the baseline category
For someone in group 1 – the value of the dummy variable for group 1 will be coded 1 and the
value for group 2 will be coded 0 – becoming:
𝑜𝑢𝑡𝑐𝑜𝑚𝑒𝑖 = 𝑏0 + (𝑏1 × 1) + (𝑏2 × 0)
This shows that the predicted outcome for someone in group 1 => the sum of bo and the b for
the dummy variable for group 1 (= b1)
Therefore, the mean of the control group = bo and the predicted outcome for someone in group
1 = the mean of that group
• We can replace bo and outcome with:
𝑋̅𝑔𝑟𝑜𝑢𝑝1 = 𝑋̅𝑐𝑜𝑛𝑡𝑟𝑜𝑙 + 𝑏1
𝑏1 = ̅𝑋𝑔𝑟𝑜𝑢𝑝1 − 𝑋̅𝑐𝑜𝑛𝑡𝑟𝑜𝑙
, • Shows that the b-value for the dummy variable representing group 1 => is the difference
between the means of that group and the control
Similarly => for group 2 the equation becomes:
𝑜𝑢𝑡𝑐𝑜𝑚𝑒𝑖 = 𝑏0 + (𝑏1 × 0) + (𝑏2 × 1)
𝑜𝑢𝑡𝑐𝑜𝑚𝑒𝑖 = 𝑏0 + 𝑏2
By replacing the variables => we can see that the b-value for group 2 represents the difference
between the means for that group and the control:
𝑋̅𝑔𝑟𝑜𝑢𝑝2 = 𝑋̅𝑐𝑜𝑛𝑡𝑟𝑜𝑙 + 𝑏2
𝑏2 = ̅𝑋𝑔𝑟𝑜𝑢𝑝2 − 𝑋̅𝑐𝑜𝑛𝑡𝑟𝑜𝑙
The output shows that the model fit was tested
with an F-statistic => which is significant
- The model represents the group means =>
this F tells us that using group means to
predict outcome scores is sig better than using
the mean of all scores
- i.e., the group means are sig different
The F-test is an overall test – and does not identify the differences between specific means
• The model parameters (b-values) do identify these differences
- The constant bo => the mean of the baseline group
- The b1 => the difference between the means of group 1 and the baseline group
- The b2 => the difference between the means of group 2 and the baseline group
Using the significance values of the associated t-tests => see that the difference between group
1 and control group (= b1) is significant at p = .008
- But the difference b/n group 2 and the control is not sig at p = .282
Logic of the F-Statistic
, The F-statistic => tests the overall fit of a linear model to a set of observed data
• It is the ratio of how good the model is – compared to how bad it is (error)
When the model is based on group means => the predictions from the model are those means
• If the group means are the same => ability to predict the observed data will be poor
(small F)
• If the means differ => able to better discriminate between cases from different groups
(large F)
In this context => F tells us whether the group means are significantly different
If the Ho: group means are equal => is true
- Then the b coefficients would all be 0 => because if the group means are equal
– then the difference between them will be 0
Mini Summary
• The model that represents ‘no effect’ or ‘no relationship b/n predictor variable and
outcome’ => one where the predicted value of the outcome is always the grand mean
- i.e., the mean of the outcome variable
• A different model can be fit to the data that represents the Ha
• The fit of the Ha model can be compared to the fit of the Ho model => i.e., using the
grand mean
• The intercept (bo) and one or more parameters (b) => describe the model
• The parameters determine the shape of the model fitted
- The bigger the coefficients => the greater the deviation b/n model and Ho model
(grand mean)
• In experimental research => the b parameters represent the differences b/n group means
- The bigger the differences b/n group means => the greater the difference b/n
model and the Ho model (grand mean)
• If the differences b/n group sizes are large enough => the resulting model will be a
better fit to the data than the Ho model (grand mean)