CHAPTER 6: SPATIAL MODELS OF
INFECTION
INTRODUCTION
So far we have always assumed that all individuals in the population we’re mixing together with each other as if
there were no space. But of course in reality there are spatial heterogeneities.
Spatial components in a system cause heterogeneities: 2 types of spatial heterogeneities
- distance effects: β changes with distance
o e.g. aerosols: higher chance of transmission to people who are sitting close to you
- structured differences: S, β differ between sites
o e.g. areas where there are structural differences important for the transmission, areas where
transmission is happening more easily than in other areas maybe because a certain vector is
present an not in another place or because the humidity is different in one area than in the
other area
o e.g. population size is different between areas, areas where density for individuals is very high
so lot of interaction while in other areas the population may be less abundant which has an
effect on the transmission of infections
EXAMPLE: PLAGUE IN GERBIL COLONIES
If there are 3 areas occupied by a gerbil colony (so the distance is low)
and one becomes infected, the probability that it will transmit to the
other two colonies is large because the infection is going to spread
quickly because the colonies are nearby.
If there are 3 areas occupied by a gerbil colony but far away from
each other (so high distance), the infection is not going to spread
because the probability of reaching the other area is too small.
Abundance is the same as in previous example (3
colonies) BUT density is also important!
DISTANCE EFFECTS: Β CHANGES WITH DISTANCE
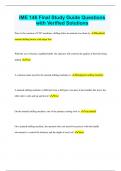
The transmission coefficient will change with the distance.
, In the graph seen we the probability that an bird (in this example) will not infect another bird based on their
distance. Here we see that the probability is very low when the birds are close to each other and high when
they are further away from each other. This means that they have a higher risk of infecting the birds that are
close by then those who are further away.
Transmission kernel (K(d)): the kernel is the distribution around a certain core for the transmission, and that
probability for the transmission to happen is very high nearby and lower further away (not 0!)
REPRESENTING DISTANCE IN TRANSMISSION MODELS
Shape of kernel
Kernel = probability distribution of distance travelled by an individual – or by the pathogenic particles it
excretes. reflects the probability for transmission.
- if individual is close by: high probability of transmission
- if individual is far away: low probability of transmission
The shape of the distribution is important:
- narrow with very high probability for transmission at a very short distance and very quick
reduction in the probability of transmission
- BUT also possible to have a flatter shape: probability for infecting individuals that are further
away is larger means something for speed at which the infection is going to spread in time
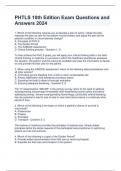
Simple spatial mode: cellular automaton / lattice-based model
We try to represent the space that we’re working in
with this kind of grid: for each of these difference places
you assign a certain state:
- Susceptible
- Incubation
- Infected
Then you find out what is the probability that an
infected individual is going to infect the neighbour cells
or set of cells further away the further you go, the
smaller the probability will become (not 0!)
Result: kind of pattern where you have course of infection and they are slowly spreading in different directions,
that is happening according to the kernel distribution.
INFECTION
INTRODUCTION
So far we have always assumed that all individuals in the population we’re mixing together with each other as if
there were no space. But of course in reality there are spatial heterogeneities.
Spatial components in a system cause heterogeneities: 2 types of spatial heterogeneities
- distance effects: β changes with distance
o e.g. aerosols: higher chance of transmission to people who are sitting close to you
- structured differences: S, β differ between sites
o e.g. areas where there are structural differences important for the transmission, areas where
transmission is happening more easily than in other areas maybe because a certain vector is
present an not in another place or because the humidity is different in one area than in the
other area
o e.g. population size is different between areas, areas where density for individuals is very high
so lot of interaction while in other areas the population may be less abundant which has an
effect on the transmission of infections
EXAMPLE: PLAGUE IN GERBIL COLONIES
If there are 3 areas occupied by a gerbil colony (so the distance is low)
and one becomes infected, the probability that it will transmit to the
other two colonies is large because the infection is going to spread
quickly because the colonies are nearby.
If there are 3 areas occupied by a gerbil colony but far away from
each other (so high distance), the infection is not going to spread
because the probability of reaching the other area is too small.
Abundance is the same as in previous example (3
colonies) BUT density is also important!
DISTANCE EFFECTS: Β CHANGES WITH DISTANCE
The transmission coefficient will change with the distance.
, In the graph seen we the probability that an bird (in this example) will not infect another bird based on their
distance. Here we see that the probability is very low when the birds are close to each other and high when
they are further away from each other. This means that they have a higher risk of infecting the birds that are
close by then those who are further away.
Transmission kernel (K(d)): the kernel is the distribution around a certain core for the transmission, and that
probability for the transmission to happen is very high nearby and lower further away (not 0!)
REPRESENTING DISTANCE IN TRANSMISSION MODELS
Shape of kernel
Kernel = probability distribution of distance travelled by an individual – or by the pathogenic particles it
excretes. reflects the probability for transmission.
- if individual is close by: high probability of transmission
- if individual is far away: low probability of transmission
The shape of the distribution is important:
- narrow with very high probability for transmission at a very short distance and very quick
reduction in the probability of transmission
- BUT also possible to have a flatter shape: probability for infecting individuals that are further
away is larger means something for speed at which the infection is going to spread in time
Simple spatial mode: cellular automaton / lattice-based model
We try to represent the space that we’re working in
with this kind of grid: for each of these difference places
you assign a certain state:
- Susceptible
- Incubation
- Infected
Then you find out what is the probability that an
infected individual is going to infect the neighbour cells
or set of cells further away the further you go, the
smaller the probability will become (not 0!)
Result: kind of pattern where you have course of infection and they are slowly spreading in different directions,
that is happening according to the kernel distribution.