SAMENVATTING STATISTIEK
Inhoudsopgave
Week 1: Theme: Descriptive statistics for one variable (part 1) / describing the association between two
variables (part 2)........................................................................................................................................... 1
Week 2: theme: effect size for crosstable (part 1) /foundation of interferencial statistics and confidence
intervals (part 2).......................................................................................................................................... 14
Week 3: Theme: hypotheses testing (part 1)/inference for one/two samples (part 2)...................................20
Test summary: what to measure, when to use, formula, interpretations and SPSS........................................28
WEEK 1: THEME: DESCRIPTIVE STATISTICS FOR ONE VARIABLE (PART 1) /
DESCRIBING THE ASSOCIATION BETWEEN TWO VARIABLES (PART 2)
Variables and types of variables
,A variable is a recorded piece of information or a characteristic about a person or
unit.
Categorical/qualitative
Remember Example Central Notes
tendency
Nominal Named Gender Mode No order
classifications: no
order based on
magnitude or size
Ordinal Ordered or rankings; Pain scale Mode & Not
small, medium, median necessari
large. Summarizing ly equal
often in proportions/ intervals
percentages
Numeric/quantitative
Remember Example Central Notes
tendency
(Discrete) Can go up to Number of people in a Mode,
infinity. Integer room median
only: a number and mean
which is not a
fraction but a
whole number.
(Continuo Measurable Water volume, age, or Mode, Not
us) amounts weight median necessari
and mean ly equal
intervals
Ratio Meaningful null & Meaningful 0 : A 0 for Mode, Exact
(belongs ratio : zero means weight, or age means median differenc
to something there is no weight or and mean e
continuou no age. between
s) numbers
Meaningful ratio : is known
someone who is 20-
year-old is twice as old
as a 10-year-old
Interval No meaningful No meaningful null:
(belongs null & ratio : an Temperature of zero
to absolute zero degrees Celsius does
continuou not mean that the
s) temperature does not
exist.
No meaningful ratio :
20 degrees Celsius is
not twice as warm as
10 degrees Celsius
! Note a point of discussion: Age variable is discussed if it belongs to ratio
(because an age of 0 means you don’t exist), however you can also interpret it as
interval because someone does exist (being two months does not make you one
years old, but you still exist).
,
, Bar Chart, Pie Chart, Frequency Tables
Frequency table shows the distribution (how cases are distributed amongst
categories ), example:
Smoking status Frequency Proportion %
Never 110 .55 55%
Past 50 .25 25%
Current 40 .20 20%
Total 200 1.00 100%
Frequency is more important in small samples and the proportion is more
important in large samples.
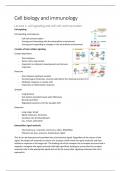
Bar chart and pie chart when you want to make a visual of the above table, these
are for categorical variables.
Bar chart Pie chart
120
100
80
60
40
20 Histogram
is 0 for
Never past Current quantative
Frequency data Never past Current
(numeric)
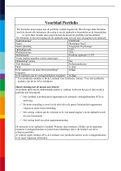
the are no gaps between bars unlike the bar chart (when there are gaps, there is
missing data). The bar width of a histogram (bin/class size) is in equal steps, it is
constant/consistent (for example 10, 20, 30, 40, etc.). The Y-axis corresponds to
the frequency (person 1 for example) (counts) and the X-axis represents the
scores (10 for example). There are steps for a histogram: example: 15 students
with grades 88, 48, 60, 51, 57, 85, 69, 75, 97, 72, 71, 79, 65, 63, 73.
First need to figure width of the bar out (bin/class size)
First: find lowest = 48
Second: find highest = 97
o A fair size could be steps of 10 (the
width)
We don’t have to start at zero; choose close to
starting point (minimum score) and end point
(maximum score) but do it within the bin size
(so in steps of 10 in this case).
Make a frequency table to help draw the histogram
The score of 48 will be in the bin of 40 but the 50 will not be included in
bin of 40. It is denoted by [40, 50). [ means include,) means not include.
Inhoudsopgave
Week 1: Theme: Descriptive statistics for one variable (part 1) / describing the association between two
variables (part 2)........................................................................................................................................... 1
Week 2: theme: effect size for crosstable (part 1) /foundation of interferencial statistics and confidence
intervals (part 2).......................................................................................................................................... 14
Week 3: Theme: hypotheses testing (part 1)/inference for one/two samples (part 2)...................................20
Test summary: what to measure, when to use, formula, interpretations and SPSS........................................28
WEEK 1: THEME: DESCRIPTIVE STATISTICS FOR ONE VARIABLE (PART 1) /
DESCRIBING THE ASSOCIATION BETWEEN TWO VARIABLES (PART 2)
Variables and types of variables
,A variable is a recorded piece of information or a characteristic about a person or
unit.
Categorical/qualitative
Remember Example Central Notes
tendency
Nominal Named Gender Mode No order
classifications: no
order based on
magnitude or size
Ordinal Ordered or rankings; Pain scale Mode & Not
small, medium, median necessari
large. Summarizing ly equal
often in proportions/ intervals
percentages
Numeric/quantitative
Remember Example Central Notes
tendency
(Discrete) Can go up to Number of people in a Mode,
infinity. Integer room median
only: a number and mean
which is not a
fraction but a
whole number.
(Continuo Measurable Water volume, age, or Mode, Not
us) amounts weight median necessari
and mean ly equal
intervals
Ratio Meaningful null & Meaningful 0 : A 0 for Mode, Exact
(belongs ratio : zero means weight, or age means median differenc
to something there is no weight or and mean e
continuou no age. between
s) numbers
Meaningful ratio : is known
someone who is 20-
year-old is twice as old
as a 10-year-old
Interval No meaningful No meaningful null:
(belongs null & ratio : an Temperature of zero
to absolute zero degrees Celsius does
continuou not mean that the
s) temperature does not
exist.
No meaningful ratio :
20 degrees Celsius is
not twice as warm as
10 degrees Celsius
! Note a point of discussion: Age variable is discussed if it belongs to ratio
(because an age of 0 means you don’t exist), however you can also interpret it as
interval because someone does exist (being two months does not make you one
years old, but you still exist).
,
, Bar Chart, Pie Chart, Frequency Tables
Frequency table shows the distribution (how cases are distributed amongst
categories ), example:
Smoking status Frequency Proportion %
Never 110 .55 55%
Past 50 .25 25%
Current 40 .20 20%
Total 200 1.00 100%
Frequency is more important in small samples and the proportion is more
important in large samples.
Bar chart and pie chart when you want to make a visual of the above table, these
are for categorical variables.
Bar chart Pie chart
120
100
80
60
40
20 Histogram
is 0 for
Never past Current quantative
Frequency data Never past Current
(numeric)
the are no gaps between bars unlike the bar chart (when there are gaps, there is
missing data). The bar width of a histogram (bin/class size) is in equal steps, it is
constant/consistent (for example 10, 20, 30, 40, etc.). The Y-axis corresponds to
the frequency (person 1 for example) (counts) and the X-axis represents the
scores (10 for example). There are steps for a histogram: example: 15 students
with grades 88, 48, 60, 51, 57, 85, 69, 75, 97, 72, 71, 79, 65, 63, 73.
First need to figure width of the bar out (bin/class size)
First: find lowest = 48
Second: find highest = 97
o A fair size could be steps of 10 (the
width)
We don’t have to start at zero; choose close to
starting point (minimum score) and end point
(maximum score) but do it within the bin size
(so in steps of 10 in this case).
Make a frequency table to help draw the histogram
The score of 48 will be in the bin of 40 but the 50 will not be included in
bin of 40. It is denoted by [40, 50). [ means include,) means not include.