SPSS
Session 1
Study on stress with the following variables:
stress: Measures whether the participant experiences stress, and where the stress comes
from
smoke: Measures the smoking behavior of the participant
relation: Whether or not the participant is involved in a long-term romantic relationship
optim: Measures how optimistic the participant is on a scale of 0 to 50
satis: Measures of life satisfaction of the participant on a scale of 0 to 50
negemo: The amount of negative emotions on a scale of 0 to 50
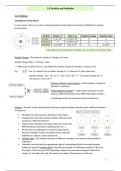
Variable view
The variable view gives an overview of the variables in the data set. Each row in the variable view
represents a variable. The columns describe the properties of the variable.
Name: A technical name for the variable. It’s an unique variable name to be used by
SPSS. It has some restrictions (e.g., may contain no blanks, should start with a letter, no
special signs (e.g., %), and can have a limited number of characters). Think of an SNR for
a student. It’s a technical code that we use in our administration system for your results
(See more details about names under the info button).
Label: A label is a description of the variable. Think of the student’s name. The label
doesn’t have to be unique, but of course it is not very convenient to use the same label for
different variables.
The difference between the name and the label is as follows: the name is a (short)
technical code for the variable. It should be unique. The label is a description of the
variable, which will also appear in the output. So, it’s important to use meaningful labels,
so it makes reading and understanding the output easier for you and your fellow
researchers.
Values: values are relevant if you have nominal or ordinal variables. For each value you
can specify a label that describes the meaning of the value (so called value labels).
Measure: it specifies the measurement level. We distinguish between three levels:
nominal, ordinal, and scale.
Data view
You will now see the data on your screen. In other words, it shows the scores on all variables for
all cases (participants) in the dataset.
Measurement levels (column “measure” in the variable view)
1- Nominal [1= No stress; 2= Work-related stress; 3= Personal-life related stress]
2- Nominal [1= Non-smoker; 2= Smoker]
3- Nominal [1= Single; 2= Relationship)
4- Scale
5- Scale
6- Scale
1
, Descriptive statistics
The first step in any statistical analysis involves inspection of the data at hand by means
of descriptive statistics and graphical summaries. This includes descriptive statistics such as the
mean, standard deviation, minimum and maximum value, amongst others. Graphical summaries
include scatter plots, bar charts, and histograms.
FREQUENCIES
SPSS reports percentages and valid percentages. These % differ when there are missing values.
DESCRIPTIVES
Histogram
Graphs → Legacy Dialogs → Histogram
Choose the variable and check the box “Display Normal Curve” OK
We can you conclude that
the data are more or less
normally distributed.
The shape of the histogram
follows the line of the normal
curve.
2
Session 1
Study on stress with the following variables:
stress: Measures whether the participant experiences stress, and where the stress comes
from
smoke: Measures the smoking behavior of the participant
relation: Whether or not the participant is involved in a long-term romantic relationship
optim: Measures how optimistic the participant is on a scale of 0 to 50
satis: Measures of life satisfaction of the participant on a scale of 0 to 50
negemo: The amount of negative emotions on a scale of 0 to 50
Variable view
The variable view gives an overview of the variables in the data set. Each row in the variable view
represents a variable. The columns describe the properties of the variable.
Name: A technical name for the variable. It’s an unique variable name to be used by
SPSS. It has some restrictions (e.g., may contain no blanks, should start with a letter, no
special signs (e.g., %), and can have a limited number of characters). Think of an SNR for
a student. It’s a technical code that we use in our administration system for your results
(See more details about names under the info button).
Label: A label is a description of the variable. Think of the student’s name. The label
doesn’t have to be unique, but of course it is not very convenient to use the same label for
different variables.
The difference between the name and the label is as follows: the name is a (short)
technical code for the variable. It should be unique. The label is a description of the
variable, which will also appear in the output. So, it’s important to use meaningful labels,
so it makes reading and understanding the output easier for you and your fellow
researchers.
Values: values are relevant if you have nominal or ordinal variables. For each value you
can specify a label that describes the meaning of the value (so called value labels).
Measure: it specifies the measurement level. We distinguish between three levels:
nominal, ordinal, and scale.
Data view
You will now see the data on your screen. In other words, it shows the scores on all variables for
all cases (participants) in the dataset.
Measurement levels (column “measure” in the variable view)
1- Nominal [1= No stress; 2= Work-related stress; 3= Personal-life related stress]
2- Nominal [1= Non-smoker; 2= Smoker]
3- Nominal [1= Single; 2= Relationship)
4- Scale
5- Scale
6- Scale
1
, Descriptive statistics
The first step in any statistical analysis involves inspection of the data at hand by means
of descriptive statistics and graphical summaries. This includes descriptive statistics such as the
mean, standard deviation, minimum and maximum value, amongst others. Graphical summaries
include scatter plots, bar charts, and histograms.
FREQUENCIES
SPSS reports percentages and valid percentages. These % differ when there are missing values.
DESCRIPTIVES
Histogram
Graphs → Legacy Dialogs → Histogram
Choose the variable and check the box “Display Normal Curve” OK
We can you conclude that
the data are more or less
normally distributed.
The shape of the histogram
follows the line of the normal
curve.
2