Natalia Levshina (2015). How to do Linguistics with R. Data exploration and
statistical analysis. John Benjamins:
https://benjamins.com/#catalog/books/z.195/main (EUR 45).
Chapter 1 – what is statistics?
Main statistical notions and principles
1.1 Statistics and statistics
Statistics, as a noun in singular like mathematics, is a set of techniques and tools for describing and
analyzing data. Statistics, as in the plural, are measures obtained from samples.
A population is a group that represents all objects of interest. The values obtained from a population
are called parameters. If the population is too big, one will deal with samples, which are meant to be
representative of the population. The difference between a sample statistic and the corresponding
population parameter is called the sampling error: the smaller, the more representative.
The best method, i.e. most reliable, is random sampling, where everyone of the population
has equal chances to be selected. Other methods are representative sampling, where the
researcher draws a sample in such a way that it matches the population on certain
characteristics, and convenience sampling, sampling to one’s convenience.
Statistics can be subdivided into descriptive statistics, describing the characteristics of a sample, and
inferential statistics, allowing the researcher to use the characteristics of a sample in order to make
conclusions about the population in general (e.g., a statistically significant difference).
1.2 How to formulate and test your hypotheses
1.2.1 Null and alternative hypotheses
Before beginning statistical analysis, a research hypothesis needs to be formulated: the research
hypothesis, your thoughts of the outcome of the research, i.e. alternative hypothesis (H0) together
with the null hypothesis (H1) which says there is no difference between, e.g., the different groups.
The alternative hypothesis can be directional, an assumed direction is expressed (e.g., X is more than
Y), or non-directional, where there is an assumption of a difference but unclear in which direction
(e.g., X is not equal to Y).
1.2.2 Those mysterious p-values…
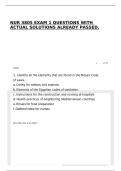
When the distribution, a collection of scores, or values, on a variable, is normal, it has a bell-shaped
figure/curve. Knowing the shape of a distribution, one can compute the exact probabilities for a
range of x.
The entire area under the curve corresponds to the probability of 1, i.e. 100%.
In case of a symmetric distribution, the middle value, e.g. 110 cm, corresponds the
probability 0.5 or 50%, e.g. 50% is under 110 cm, or 50% is above 110 cm.
1
, The p-value shows the probability of obtaining a given test statistic value or more extreme values if
the null hypothesis is true. If the p-value is smaller than some conventional level (usually 0.05 or
0.01), then the null-hypothesis is rejected and it is to believe that the result is not due to chance.
P<0.05, H0 = rejected, and there is a true difference between, e.g., the groups.
P>0.05, H0 = accepted, so there is no sufficient evidence that the, e.g., groups are different.
The number of the p-value, e.g. 0.05, is the significant level: the degree of risk you are willing to take
that you will reject a null hypothesis that is actually true. It needs to be decided on before the
statistical analysis.
In order to compute the p-value, one has to know the number of degrees of freedom (df): the
number of values that are free to vary, which is often the sample size minus one.
1.2.3 Type I and Type II errors
If H0 is rejected, when it is in fact true, meaning there is no true difference between the groups,
there is a Type I error; ‘false alarm’ or ‘false positive’. If the significance level is 0.05, there is a 5%
chance of rejecting H0 when it is in fact true.
If H0 is accepted, while it is in fact false, meaning there is a true difference between the groups,
there is a Type II error; ‘false negative’.
Decreasing the significance level will decrease the changes of a Type I error, and increase the chances
of a Type II error.
1.2.4 One-tailed and two-tailed statistical tests
The distinction of a (non-)directional H1 is important when one chooses an appropriate statistical
test. Most tests come in two flavors: one-tailed, if H1 is directional, and two-tailed, if H1 is non-
directional.
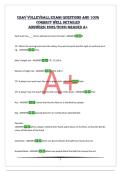
If H1 is ‘X is greater than Y’, the test statistic
should be somewhere in the blue area. If it
would be ‘smaller’, then the test statistics
should be located on the left.
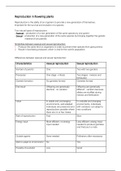
If H1 is ‘X is different from Y’, you can observe
an extreme result either in the left or right tail.
It is crucial that you formulate your alternative hypothesis and make your choice between one- and
two-tailed tests before you compute any test statistic.
2
statistical analysis. John Benjamins:
https://benjamins.com/#catalog/books/z.195/main (EUR 45).
Chapter 1 – what is statistics?
Main statistical notions and principles
1.1 Statistics and statistics
Statistics, as a noun in singular like mathematics, is a set of techniques and tools for describing and
analyzing data. Statistics, as in the plural, are measures obtained from samples.
A population is a group that represents all objects of interest. The values obtained from a population
are called parameters. If the population is too big, one will deal with samples, which are meant to be
representative of the population. The difference between a sample statistic and the corresponding
population parameter is called the sampling error: the smaller, the more representative.
The best method, i.e. most reliable, is random sampling, where everyone of the population
has equal chances to be selected. Other methods are representative sampling, where the
researcher draws a sample in such a way that it matches the population on certain
characteristics, and convenience sampling, sampling to one’s convenience.
Statistics can be subdivided into descriptive statistics, describing the characteristics of a sample, and
inferential statistics, allowing the researcher to use the characteristics of a sample in order to make
conclusions about the population in general (e.g., a statistically significant difference).
1.2 How to formulate and test your hypotheses
1.2.1 Null and alternative hypotheses
Before beginning statistical analysis, a research hypothesis needs to be formulated: the research
hypothesis, your thoughts of the outcome of the research, i.e. alternative hypothesis (H0) together
with the null hypothesis (H1) which says there is no difference between, e.g., the different groups.
The alternative hypothesis can be directional, an assumed direction is expressed (e.g., X is more than
Y), or non-directional, where there is an assumption of a difference but unclear in which direction
(e.g., X is not equal to Y).
1.2.2 Those mysterious p-values…
When the distribution, a collection of scores, or values, on a variable, is normal, it has a bell-shaped
figure/curve. Knowing the shape of a distribution, one can compute the exact probabilities for a
range of x.
The entire area under the curve corresponds to the probability of 1, i.e. 100%.
In case of a symmetric distribution, the middle value, e.g. 110 cm, corresponds the
probability 0.5 or 50%, e.g. 50% is under 110 cm, or 50% is above 110 cm.
1
, The p-value shows the probability of obtaining a given test statistic value or more extreme values if
the null hypothesis is true. If the p-value is smaller than some conventional level (usually 0.05 or
0.01), then the null-hypothesis is rejected and it is to believe that the result is not due to chance.
P<0.05, H0 = rejected, and there is a true difference between, e.g., the groups.
P>0.05, H0 = accepted, so there is no sufficient evidence that the, e.g., groups are different.
The number of the p-value, e.g. 0.05, is the significant level: the degree of risk you are willing to take
that you will reject a null hypothesis that is actually true. It needs to be decided on before the
statistical analysis.
In order to compute the p-value, one has to know the number of degrees of freedom (df): the
number of values that are free to vary, which is often the sample size minus one.
1.2.3 Type I and Type II errors
If H0 is rejected, when it is in fact true, meaning there is no true difference between the groups,
there is a Type I error; ‘false alarm’ or ‘false positive’. If the significance level is 0.05, there is a 5%
chance of rejecting H0 when it is in fact true.
If H0 is accepted, while it is in fact false, meaning there is a true difference between the groups,
there is a Type II error; ‘false negative’.
Decreasing the significance level will decrease the changes of a Type I error, and increase the chances
of a Type II error.
1.2.4 One-tailed and two-tailed statistical tests
The distinction of a (non-)directional H1 is important when one chooses an appropriate statistical
test. Most tests come in two flavors: one-tailed, if H1 is directional, and two-tailed, if H1 is non-
directional.
If H1 is ‘X is greater than Y’, the test statistic
should be somewhere in the blue area. If it
would be ‘smaller’, then the test statistics
should be located on the left.
If H1 is ‘X is different from Y’, you can observe
an extreme result either in the left or right tail.
It is crucial that you formulate your alternative hypothesis and make your choice between one- and
two-tailed tests before you compute any test statistic.
2