Introduction
The aim of this experiment is to determine the effect hydrogen peroxide
(H2O2) has on different enzymes from the citric acid cycle. A routine
requirement of enzyme assays is to first determine the protein
concentration. For this protein quantification, a colorimetric method
termed detergent compatible (DC) protein assay from Bio-Rad is used.
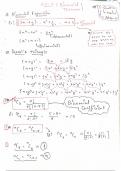
Figure 1 illustrates that Folin-Ciocalteau reagent together with cupric
Figure 1: Biuret and Folin-Ciocalteau reaction
sulphate solution causes a blue-purple colour to be produced that can be
quantified by its absorbance. The intensity of the colour is proportional to the amount of protein in
the sample. A surfactant is used to reduce surface tension.
After protein quantification, enzyme activity of aconitase
and citrate synthase will be measured at different H 2O2
concentrations. Oxidative stress caused by H 2O2 is expected
to inhibit enzyme activity. Aconitase catalyses isomerization
of citrate into isocitrate, as demonstrated by figure 2. The
amount of isocitrate can then be measured by adding
oxidized nicotinamide-adenine-dinucleotide phosphate Figure 2: Aconitase isomerization
+
(NADP ) and isocitrate dehydrogenase (IDH) to initiate a colour
reaction.
Figure 3 illustrates how citrate synthase catalyses the formation of
citrate from acetyl coenzyme A (acetyl CoA) and oxaloacetic acid
(OAA). 5,5'-Dithiobis-(2-nitrobenzoic acid) (DTNB) is added to
initiate a quantifiable colour reaction that is caused by Figure 3: Citrate synthase
deacetylation of acetyl CoA.
The learning goal is to gain experience with performing protein and enzyme assays.
Materials & Methods
For a more detailed protocol, consult the lab journal of week 1.
Protein quantification
First, standard curve dilutions were prepared with stock bovine serum albumin (BSA, 1.5mg/ml)
according to the schedule in table 1. Tromethamine buffer (TRIS, 50mM, pH 7.4) was used for
dilutions. The TRIS buffer an BSA solution were pipetted into Eppendorf tubes corresponding to each
dilution.
, Table 1: Standard curve dilutions. BSA with known protein concentration.
Secondly, protein sample dilutions were prepared with a sample containing proteins derived from
homogenized rat liver and followed the schedule in table 2. TRIS buffer and sample were pipetted
into Eppendorf tubes.
Table 2: Protein sample dilutions. Rat liver sample with unknown protein concentration.
A reagent mix was also prepared according to table 3. This mix consisted of alkaline copper tartrate
(A), surfactant solution (S), and Folin-Ciocalteau reagent (B). The total volume of A+S was pipetted
into 1 tube and the total volume of B in another.
Table 3: Reagent mix.
The aim of this experiment is to determine the effect hydrogen peroxide
(H2O2) has on different enzymes from the citric acid cycle. A routine
requirement of enzyme assays is to first determine the protein
concentration. For this protein quantification, a colorimetric method
termed detergent compatible (DC) protein assay from Bio-Rad is used.
Figure 1 illustrates that Folin-Ciocalteau reagent together with cupric
Figure 1: Biuret and Folin-Ciocalteau reaction
sulphate solution causes a blue-purple colour to be produced that can be
quantified by its absorbance. The intensity of the colour is proportional to the amount of protein in
the sample. A surfactant is used to reduce surface tension.
After protein quantification, enzyme activity of aconitase
and citrate synthase will be measured at different H 2O2
concentrations. Oxidative stress caused by H 2O2 is expected
to inhibit enzyme activity. Aconitase catalyses isomerization
of citrate into isocitrate, as demonstrated by figure 2. The
amount of isocitrate can then be measured by adding
oxidized nicotinamide-adenine-dinucleotide phosphate Figure 2: Aconitase isomerization
+
(NADP ) and isocitrate dehydrogenase (IDH) to initiate a colour
reaction.
Figure 3 illustrates how citrate synthase catalyses the formation of
citrate from acetyl coenzyme A (acetyl CoA) and oxaloacetic acid
(OAA). 5,5'-Dithiobis-(2-nitrobenzoic acid) (DTNB) is added to
initiate a quantifiable colour reaction that is caused by Figure 3: Citrate synthase
deacetylation of acetyl CoA.
The learning goal is to gain experience with performing protein and enzyme assays.
Materials & Methods
For a more detailed protocol, consult the lab journal of week 1.
Protein quantification
First, standard curve dilutions were prepared with stock bovine serum albumin (BSA, 1.5mg/ml)
according to the schedule in table 1. Tromethamine buffer (TRIS, 50mM, pH 7.4) was used for
dilutions. The TRIS buffer an BSA solution were pipetted into Eppendorf tubes corresponding to each
dilution.
, Table 1: Standard curve dilutions. BSA with known protein concentration.
Secondly, protein sample dilutions were prepared with a sample containing proteins derived from
homogenized rat liver and followed the schedule in table 2. TRIS buffer and sample were pipetted
into Eppendorf tubes.
Table 2: Protein sample dilutions. Rat liver sample with unknown protein concentration.
A reagent mix was also prepared according to table 3. This mix consisted of alkaline copper tartrate
(A), surfactant solution (S), and Folin-Ciocalteau reagent (B). The total volume of A+S was pipetted
into 1 tube and the total volume of B in another.
Table 3: Reagent mix.