BUS 111-Ch03 Demand and Supply.Multiple Choice Questions
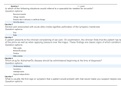
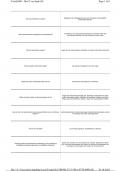
BUS 111-Ch03 Demand and Supply. Multiple Choice Questions 1. The downward slope of the demand curve again illustrates the pattern that as _____________ rises, _________________ decreases. A. quantity demanded, price B. quantity supplied, quantity demanded C. price, quantity demanded D. price, quantity supplied Answer: C Reference: Explanation: 2. The nature of demand indicates that as the price of a good increases: A. suppliers wish to sell less of it. B. more of it is produced. C. more of it is desired. D. buyers desire to purchase less of it. Answer: D Reference: Explanation: 3. Any given demand or supply curve is based on the ceteris paribus assumption that ___________________. A. everything is variable. B. all else is held equal C. no one knows which variables will change and which will remain constant. D. what is true for the individual is not necessarily true for the whole. Answer: B Reference: Explanation: 4. The term "ceteris paribus" means that: A. everything is variable. B. all variables except those specified are constant. C. no one knows which variables will change and which will remain constant. D. what is true for the individual is not necessarily true for the whole. Answer: B Reference: Explanation: Category: Remember 5. A supply curve is a graphical illustration of the relationship between price, shown on the vertical axis, and ____________, shown on the horizontal axis. A. demand B. quantity C. quantity supplied D. quantity demanded Answer: B Reference: Explanation: 6. Economists refer to the relationship that a higher price leads to a lower quantity demanded as the _____________. A. income gap B. market equilibrium C. law of demand D. price model Answer: C Reference: Explanation: 7. A demand curve shows the relationship between price and _________________ on a graph. A. quantity demanded B. quantity produced C. economies of scale D. costs Answer: A Reference: Explanation: 8. _________________ refers to the total number of units that are purchased at that price. A. quantity B. quantity demanded C. supply D. market quantity Answer: B Reference: Explanation:

Geschreven voor
- Instelling
- State University Of New York - Stony Brook
- Vak
- BUS 111
Documentinformatie
- Geüpload op
- 22 juli 2021
- Aantal pagina's
- 13
- Geschreven in
- 2020/2021
- Type
- Tentamen (uitwerkingen)
- Bevat
- Vragen en antwoorden
Onderwerpen
-
bus 111
-
bus 111 ch03 demand and supplymultiple choice questions
-
ch03 demand and supplymultiple choice questions