STATISTICS II LECTURES SUMMARY
Lecture 1 One-way ANOVA
Comparing means of groups
▪ Do two groups have the same population mean?
→ t-test
“Is there a difference in the effectiveness between two methods for reading lessons
for second-graders?”
▪ Do three or more groups have the same population mean?
→ ANOVA
“Is there a difference in the effectiveness between three methods for reading lessons
for second-graders?”
You can test the second question with multiple t-tests, but this comes with the inflation of
surprise → when one performs multiple comparisons on the same data, the probability of
finding a result goes up: Type I error
▪ e.g. consider 3 groups: A, B, C. We have 3 pairwise comparisons (A, B), (A, C), (B, C)
- p < 0.05, so the probability of no Type I error is 95%
- Each test is conducted three times, so the probability of no Type I error is 0.95 3 =
0.857
- Probability of Type I error is 1-0.857 = 14.3%
ANOVA stands for analysis of variance, we compare the means of three or more groups
Three different types of ANOVA will be covered:
▪ One-way
- observations are independent (each subject is measured once)
- one experimental condition
- between-group variables = different groups or subjects assigned to different
conditions
▪ Factorial
- observations are independent
- two or more experimental conditions, we can measure individual effects and
interactions
- between-group variables
▪ Repeated measures
- each subject is tested more than once, or
- each stimulus is presented more than once
- within-subject variables = the same subjects tested in more than one condition
When an experiment uses both between-group variables and within-subject variables, mixed
ANOVA is used
1
,One-way ANOVA – Step by Step in R
1. Hypotheses
2. Start with descriptive statistics to see what the data looks like
→ when data is relatively similar, the medians will be close to each other. When the data is
skewed, the medians will be further away from each other.
3. Run test
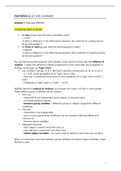
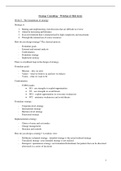
Source
Groups reflects variability between the groups
Error reflects the variability within the groups
DFS
DFG = nr. of groups (I) – 1
DFE = nr. of observations (N) – nr. of groups (I)
Sum squares
SSG = how much variation there is between groups
SSE = how much variation there is within groups
2
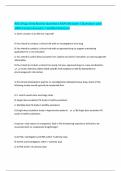
,F-value
MSG/MSE = variation normalized by the degrees of freedom in the groups divided by the
normalized variation in the error
Between-group variation: formulas
SSG = Sum of Squares Group
▪ Measures variation of the group means around the overall mean
ni = nr. of observations in each group
x̄ = overall mean
DFG = Degrees of Freedom groups
▪ SSG measures variation of the I sample means around one overall mean, its degrees
of freedom are I – 1
MSG = Mean Sum of Squares groups
▪ SSG / DFG
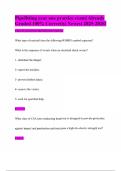
Within-group variation: formulas
SSE = Sum of Squares Error
▪ Measures variation of observations around their group mean
^ through each group, and within each group through each observation
DFE = Degrees of Freedom error
▪ Since we have N observations being compared to I sample means, the degrees of
freedom are N – I
MSE = Mean Sum of Squares error
▪ SSE / DFE
Once you have calculated MSG and MSE, you can calculate F
F-value is a statistic that is approximately 1 if H0 is true and tends to be larger if Ha is true.
→ the p-value gets calculated by F and the degrees of freedom
▪ F = MSG / MSE
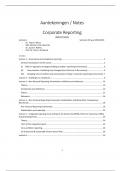
Effect size
R2 or n2 (eta squared) shows the proportion of the variability in the outcome variable that
can be explained in terms of the predictor
→ e.g. what percentage of the number of modulations can be explained by differences in age
3
, ▪ n2 = SSG / SSG + SSE (= SST)
→ e.g. 63% (0.63) of the variation in the differences between groups is explained by the age
distinction
→ R squared can be inflated by adding non-significant terms to the model (more predictors),
so use adjusted R squared instead of R squared; its value will always be equal to or less than
that of R squared
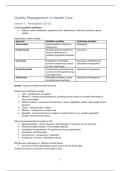
Post-hoc tests
With ANOVA, we only get to know whether all groups means are the same or not. Post-hoc
tests are conducted to find out which group means differ from each other
→ conduct multiple t-test between each pair of groups, but with a correction!
▪ Bonferroni alpha = divide alpha level by number of comparisons/tests
▪ Holm
→ more powerful and less chance of Type II error
Assumptions
1. Independence
→ observations are independent
2. Interval scale
→ response variable is at least interval-scaled
3. Normality
→ the residuals are normally distributed (each sample is drawn from a normally distributed
population)
▪ Use Shapiro-Wilk test
H0 = each group follows a normal distribution
When p < 0.05, the group does not follow a normal distribution
4. Homogeneity of variance
→ the variance is homoscedastic, i.e. the variances in all groups are equal
▪ Use Levene’s test
H0 = the variances in the different groups are equal
When p < 0.05, variance is not equal
▪ Use Fligner-Killeen test when data is not normally distributed
There are multiple alternative tests when assumptions are still not met:
▪ No equal variance: Welch one-way test, oneway.test()
▪ Non-normality: Kruskal-Wallis test, kruskal.test()
H0 = the population median is the same for all groups
▪ Both violated: non-parametric ANOVA, oneway_test()
4
Lecture 1 One-way ANOVA
Comparing means of groups
▪ Do two groups have the same population mean?
→ t-test
“Is there a difference in the effectiveness between two methods for reading lessons
for second-graders?”
▪ Do three or more groups have the same population mean?
→ ANOVA
“Is there a difference in the effectiveness between three methods for reading lessons
for second-graders?”
You can test the second question with multiple t-tests, but this comes with the inflation of
surprise → when one performs multiple comparisons on the same data, the probability of
finding a result goes up: Type I error
▪ e.g. consider 3 groups: A, B, C. We have 3 pairwise comparisons (A, B), (A, C), (B, C)
- p < 0.05, so the probability of no Type I error is 95%
- Each test is conducted three times, so the probability of no Type I error is 0.95 3 =
0.857
- Probability of Type I error is 1-0.857 = 14.3%
ANOVA stands for analysis of variance, we compare the means of three or more groups
Three different types of ANOVA will be covered:
▪ One-way
- observations are independent (each subject is measured once)
- one experimental condition
- between-group variables = different groups or subjects assigned to different
conditions
▪ Factorial
- observations are independent
- two or more experimental conditions, we can measure individual effects and
interactions
- between-group variables
▪ Repeated measures
- each subject is tested more than once, or
- each stimulus is presented more than once
- within-subject variables = the same subjects tested in more than one condition
When an experiment uses both between-group variables and within-subject variables, mixed
ANOVA is used
1
,One-way ANOVA – Step by Step in R
1. Hypotheses
2. Start with descriptive statistics to see what the data looks like
→ when data is relatively similar, the medians will be close to each other. When the data is
skewed, the medians will be further away from each other.
3. Run test
Source
Groups reflects variability between the groups
Error reflects the variability within the groups
DFS
DFG = nr. of groups (I) – 1
DFE = nr. of observations (N) – nr. of groups (I)
Sum squares
SSG = how much variation there is between groups
SSE = how much variation there is within groups
2
,F-value
MSG/MSE = variation normalized by the degrees of freedom in the groups divided by the
normalized variation in the error
Between-group variation: formulas
SSG = Sum of Squares Group
▪ Measures variation of the group means around the overall mean
ni = nr. of observations in each group
x̄ = overall mean
DFG = Degrees of Freedom groups
▪ SSG measures variation of the I sample means around one overall mean, its degrees
of freedom are I – 1
MSG = Mean Sum of Squares groups
▪ SSG / DFG
Within-group variation: formulas
SSE = Sum of Squares Error
▪ Measures variation of observations around their group mean
^ through each group, and within each group through each observation
DFE = Degrees of Freedom error
▪ Since we have N observations being compared to I sample means, the degrees of
freedom are N – I
MSE = Mean Sum of Squares error
▪ SSE / DFE
Once you have calculated MSG and MSE, you can calculate F
F-value is a statistic that is approximately 1 if H0 is true and tends to be larger if Ha is true.
→ the p-value gets calculated by F and the degrees of freedom
▪ F = MSG / MSE
Effect size
R2 or n2 (eta squared) shows the proportion of the variability in the outcome variable that
can be explained in terms of the predictor
→ e.g. what percentage of the number of modulations can be explained by differences in age
3
, ▪ n2 = SSG / SSG + SSE (= SST)
→ e.g. 63% (0.63) of the variation in the differences between groups is explained by the age
distinction
→ R squared can be inflated by adding non-significant terms to the model (more predictors),
so use adjusted R squared instead of R squared; its value will always be equal to or less than
that of R squared
Post-hoc tests
With ANOVA, we only get to know whether all groups means are the same or not. Post-hoc
tests are conducted to find out which group means differ from each other
→ conduct multiple t-test between each pair of groups, but with a correction!
▪ Bonferroni alpha = divide alpha level by number of comparisons/tests
▪ Holm
→ more powerful and less chance of Type II error
Assumptions
1. Independence
→ observations are independent
2. Interval scale
→ response variable is at least interval-scaled
3. Normality
→ the residuals are normally distributed (each sample is drawn from a normally distributed
population)
▪ Use Shapiro-Wilk test
H0 = each group follows a normal distribution
When p < 0.05, the group does not follow a normal distribution
4. Homogeneity of variance
→ the variance is homoscedastic, i.e. the variances in all groups are equal
▪ Use Levene’s test
H0 = the variances in the different groups are equal
When p < 0.05, variance is not equal
▪ Use Fligner-Killeen test when data is not normally distributed
There are multiple alternative tests when assumptions are still not met:
▪ No equal variance: Welch one-way test, oneway.test()
▪ Non-normality: Kruskal-Wallis test, kruskal.test()
H0 = the population median is the same for all groups
▪ Both violated: non-parametric ANOVA, oneway_test()
4