PUBLIC SECTOR
ECONOMICS:
SUMMARY
@ECOsummaries
→ 20% discount
1
,Table of contents
Week 1_________________________________________________page 3-7
Week 2_________________________________________________page 8-12
Week 3_________________________________________________page 13-21
Week 4_________________________________________________page 22-29
Week 5_________________________________________________page 30-35
Week 6_________________________________________________page 36-43
Week 7_________________________________________________page 44-48
Week 8_________________________________________________page 49-54
Week 9_________________________________________________page 55-60
Week 10________________________________________________page 61-67
Week 11________________________________________________page 68-72
Week 12________________________________________________page 73-78
Week 13________________________________________________page 79-83
2
,Week 1 - Introduction
The basics of Public Economics
Public economics: the study of the role of the government in the economy
4 main questions:
- When should the government intervene?
- How might the government intervene?
- What is the effect of those interventions?
- Why do government intervene in the way they do?
When should the government intervene?
Market failures: may lead to inefficient equilibria
Examples: markets that are not competitive, irrational players, information asymmetry, moral
hazard, externalities etc.
Redistribution: may be necessary if we care about more things than just efficiency
→ Equality vs. Efficiency
How might the government intervene?
1. Influence price mechanism: taxes/subsidies.
Example: tax on tobacco.
2. Restrict/mandate transactions: make things illegal or mandatory.
Example: mandatory insurance / illegal gun use.
3. Public provision of goods: make things available to everyone.
Example: public safety.
4. Public financing or private provision.
What is the effect of those interventions?
Empirical public economics: evaluation of a variation of different policy options.
Direct effects: effects that arise because no agent changes behaviour.
Example: tax on cigarettes → more tax revenue for the government.
Indirect effects: effect that arise because agents change behaviour.
Example: tax on cigarettes → more expensive → fewer customers that buy cigarettes .
Why do governments intervene in the way they do?
Normative: ‘’how SHOULD the government act?’’
Positive: ‘’how DOES the government act?’’
➔ These can differ quite a lot because, they cannot aggregate all preferences from everyone.
Also, it is hard to find out what people want to start with. And lastly, government may have
different preferences than the population (re-election purposes)
3
,The importance of public economics
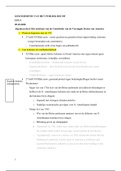
Government spending as % of
GDP is on the rise.
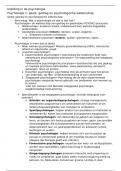
The theoretical tools of public economics
Utility maximization
- Indifference curves
- Budget constraint
→ because it is possible to get ‘’rent
subsidy’’, you can consume more if you
work less (=more leisure)
→ These kinks will let the indifference
curves shift up to the point where they
cross the kink.
➔ This will often lead to corner
solutions.
This will give us an estimate of welfare and this can be pictured in a figure:
→ Here, you can observe the deadweight loss in situations with
different supply-curves.
4
, The empirical tools of public economics
Important: only looking at theory is not sufficient. You need to check if certain assumptions hold in
reality. You do this by looking at empirical studies.
Correlation: two variables move together
Causation: one variable causes another variable to shift
Example:
Cheese consumption and deaths from bedsheets are highly correlated when looking at the data. But
they obviously are not!
Hence, do not blindly accept anything, always think of possible other reasons why things could be
correlated or have causation.
Three reasons why correlations may be not what it seems:
1. Reverse causality: instead of X causing Y, Y is causing X.
Example: there is a lot of police in a high-crime area. You could state that by putting more
police somewhere, the crime rate will go up. But it is the other way around.
Lucas’ critique: using lags is not a good remedy.
2. Chance: just by randomness X and Y could be related
→ use p-value (P-value of 0.05 means a 5% probability of correlation by chance)
3. Omitted-variable bias: an unobserved variable Z is causing both X and Y
Example: Climate causes both health and wine consumption. So, by saying that wine causes
your health to be better is false.
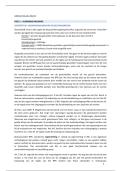
‘’In this time-series graph you could
argue that higher cigarette prices cause
lower cigarette consumption. However,
there could be a million reasons why
consumptions went down, think off
habits or other circumstances.’’
5
ECONOMICS:
SUMMARY
@ECOsummaries
→ 20% discount
1
,Table of contents
Week 1_________________________________________________page 3-7
Week 2_________________________________________________page 8-12
Week 3_________________________________________________page 13-21
Week 4_________________________________________________page 22-29
Week 5_________________________________________________page 30-35
Week 6_________________________________________________page 36-43
Week 7_________________________________________________page 44-48
Week 8_________________________________________________page 49-54
Week 9_________________________________________________page 55-60
Week 10________________________________________________page 61-67
Week 11________________________________________________page 68-72
Week 12________________________________________________page 73-78
Week 13________________________________________________page 79-83
2
,Week 1 - Introduction
The basics of Public Economics
Public economics: the study of the role of the government in the economy
4 main questions:
- When should the government intervene?
- How might the government intervene?
- What is the effect of those interventions?
- Why do government intervene in the way they do?
When should the government intervene?
Market failures: may lead to inefficient equilibria
Examples: markets that are not competitive, irrational players, information asymmetry, moral
hazard, externalities etc.
Redistribution: may be necessary if we care about more things than just efficiency
→ Equality vs. Efficiency
How might the government intervene?
1. Influence price mechanism: taxes/subsidies.
Example: tax on tobacco.
2. Restrict/mandate transactions: make things illegal or mandatory.
Example: mandatory insurance / illegal gun use.
3. Public provision of goods: make things available to everyone.
Example: public safety.
4. Public financing or private provision.
What is the effect of those interventions?
Empirical public economics: evaluation of a variation of different policy options.
Direct effects: effects that arise because no agent changes behaviour.
Example: tax on cigarettes → more tax revenue for the government.
Indirect effects: effect that arise because agents change behaviour.
Example: tax on cigarettes → more expensive → fewer customers that buy cigarettes .
Why do governments intervene in the way they do?
Normative: ‘’how SHOULD the government act?’’
Positive: ‘’how DOES the government act?’’
➔ These can differ quite a lot because, they cannot aggregate all preferences from everyone.
Also, it is hard to find out what people want to start with. And lastly, government may have
different preferences than the population (re-election purposes)
3
,The importance of public economics
Government spending as % of
GDP is on the rise.
The theoretical tools of public economics
Utility maximization
- Indifference curves
- Budget constraint
→ because it is possible to get ‘’rent
subsidy’’, you can consume more if you
work less (=more leisure)
→ These kinks will let the indifference
curves shift up to the point where they
cross the kink.
➔ This will often lead to corner
solutions.
This will give us an estimate of welfare and this can be pictured in a figure:
→ Here, you can observe the deadweight loss in situations with
different supply-curves.
4
, The empirical tools of public economics
Important: only looking at theory is not sufficient. You need to check if certain assumptions hold in
reality. You do this by looking at empirical studies.
Correlation: two variables move together
Causation: one variable causes another variable to shift
Example:
Cheese consumption and deaths from bedsheets are highly correlated when looking at the data. But
they obviously are not!
Hence, do not blindly accept anything, always think of possible other reasons why things could be
correlated or have causation.
Three reasons why correlations may be not what it seems:
1. Reverse causality: instead of X causing Y, Y is causing X.
Example: there is a lot of police in a high-crime area. You could state that by putting more
police somewhere, the crime rate will go up. But it is the other way around.
Lucas’ critique: using lags is not a good remedy.
2. Chance: just by randomness X and Y could be related
→ use p-value (P-value of 0.05 means a 5% probability of correlation by chance)
3. Omitted-variable bias: an unobserved variable Z is causing both X and Y
Example: Climate causes both health and wine consumption. So, by saying that wine causes
your health to be better is false.
‘’In this time-series graph you could
argue that higher cigarette prices cause
lower cigarette consumption. However,
there could be a million reasons why
consumptions went down, think off
habits or other circumstances.’’
5