LITERATUUR WEEK 2
FIELD
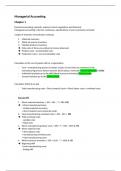
CHAPTER 7 NON-PARAMETRIC MODELS
7.1 WHAT WILL THIS CHAPTER TELL ME
Trying to make an ugly duckling of a data set turn into a swan.
7.2 WHEN TO USE NON-PARAMETRIC TESTS
When you have a small sample and can’t rely on the central limit theorem to get you out of trouble. This
historical solution is a small family of models called non-parametric tests or ‘assumption-free tests’ that make
fewer assumptions than the linear model. Non-parametric tests act as a gentle introduction to using a
statistical test to evaluate a hypothesis. In this chapter, we’ll explore four of the most common non-parametric
procedures; the Mann-Whitney test, the Wilcoxon signed-rank test, Friedman’s test and Kruskal-Wallis test. All
four tests overcome distributional problems by ranking the data: that is, finding the lowest score and giving it a
rank of 1, then finding the next highest score and giving it a rank 2 and so on. This process results in high scores
being represented in large ranks and low scores being represented in small ranks. Imagine you have 20 data
points and the two highest scores are 30 and 60, these scores will become rank 19 and 20.
7.4 COMPARING TWO INDEPENDENT CONDITIONS ; THE WILCOXON RANK-SUM TEST AND MANN-
WHITNEW TEST
Imagine that you have a hypothesis that two groups of different entities will differ from each other on some
variable. A psychologist collects data to investigate the depressant effect of two recreational drugs. She testen
20 clubbres: 10 were given an ecstasy tablet and 10 drank alcohol. Levels of depression were measurd using
the Beck Depression Inventory the day after and at midweek. She had 2 hypotheses: between those who took
slcohol and those who took ecstasy, depression levels will be different the day after ( hypothesis 1 ) and mid-
week ( hypothesis 2). To test these hypotheses , we need to fit a model that compares the distribution in the
alcohol group to that in the ecstasy group.
There are two choices to compare the distribution in two conditions containing scores form different entitities
7.4.1 THEORY
The logic behind the Wilcoxon rank-sum and Mann-Whitney test is incredibly elegant.
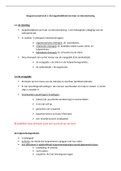
,First, let’s imagine a scenario in which
there is no difference in depression
levels between ecstasy and alcohol
users. If you were to rank the data
ignoring the group to which a person
belonged from lowest to highest, if
there’s no difference between the
groups then you should find a similar
number of high and low ranks in each
group. If you would add up the ranks
you would get about the same number.
Now let’s imagine that the ecstasy group is more depressed than
the alcohol group. If you rank the scores, then you would expect more higher ranks in the ecstasy group and
more lower ranks to be in the alcohol group. When you would sum the ranks in each group, we’d expect the
sum of ranks to be higher in the ecstasy group than in the alcohol group.
The Mann-Whitney and Wilcoxon rank-sum test use this
principle. In fact, when the groups have unequal numbers of participant in them, the test statistics for the
Wilcoxon rank-sum test (Ws) is simply the sum of ranks in the group that contains the fewer people, when the
group sizes are equal it’s the value of the smaller summed rank.
How do we determine whether this test statistic is significant? It turns out that the mean ( ) and standard
error ( ) of this test statistic can be calculated from the sample size of each group ( n 1 is the sample size
of group 1 and n2 is the sample size of group 2 ).
Then the equation of the mean is: The equation of the Standard error is :
When having equal groups with 10 people each n1 and n2 are both 10. So the equations are:
and
If we know the test statistic, the mean test statistic and the standard error, then we can convert the test
statistic to a z-score using the equation:
We also know that we can use the table to ascertain a p-value for a z-score. The z-scores for the Sunday and
Wednesday depression scores are:
and
So there is a significant difference between the groups on the Wednesday, but not on Sunday.
, The Mann-Whitney test is basically the same, but uses a statistic U , which has a direct relationship with the
Wilcoxon test statistic. U is calculated using an equation in which n 1 and n2 are the sample sized of groups 1 and
2 respectively. And R1 is the sum of ranks for group 1 :
Four our data we’d get the following ( 10 people in each group, sum of ranks for group 1 ( ecstasy ) was 119.5
for Sunday and 151 for Wednesday:
7.4.4 OUTPUT FROM THE MANN-WHITNEY TEST
With all non-parametric tests, the
output contains a summary table. The
model viewer is divided into two panels:
the left-hand panel shows the summary
table of any analyses that you have
done, and the right-hand panel shows
the details of the analysis.
Underneath the graph a table shows the
test statistics for the Mann-Whitney
test , the Wilcoxon procedure and the
corresponding z-score. The rows labelled
asymptotic , sig. and exact sig. tell us the
probability that a test statistic of at least
that magniute would occur if there were
no differences in the group. The two p-
values are interpreted in the same way
but are computed differently.
7.4.6 WRITING THE RESULTS
For the Mann-Whitney test, report only the test statistic ( denoted by U ) and its significance. In keeping with
good practice , include the effect size and report exact values of p.
If you want to report Wilcoxon test rather than Mann-Whitney U statistic you could write
7.5 COMPARING TWO RELATED CONDITIONS: THE WILCOXON SIGNED-RANK TEST
FIELD
CHAPTER 7 NON-PARAMETRIC MODELS
7.1 WHAT WILL THIS CHAPTER TELL ME
Trying to make an ugly duckling of a data set turn into a swan.
7.2 WHEN TO USE NON-PARAMETRIC TESTS
When you have a small sample and can’t rely on the central limit theorem to get you out of trouble. This
historical solution is a small family of models called non-parametric tests or ‘assumption-free tests’ that make
fewer assumptions than the linear model. Non-parametric tests act as a gentle introduction to using a
statistical test to evaluate a hypothesis. In this chapter, we’ll explore four of the most common non-parametric
procedures; the Mann-Whitney test, the Wilcoxon signed-rank test, Friedman’s test and Kruskal-Wallis test. All
four tests overcome distributional problems by ranking the data: that is, finding the lowest score and giving it a
rank of 1, then finding the next highest score and giving it a rank 2 and so on. This process results in high scores
being represented in large ranks and low scores being represented in small ranks. Imagine you have 20 data
points and the two highest scores are 30 and 60, these scores will become rank 19 and 20.
7.4 COMPARING TWO INDEPENDENT CONDITIONS ; THE WILCOXON RANK-SUM TEST AND MANN-
WHITNEW TEST
Imagine that you have a hypothesis that two groups of different entities will differ from each other on some
variable. A psychologist collects data to investigate the depressant effect of two recreational drugs. She testen
20 clubbres: 10 were given an ecstasy tablet and 10 drank alcohol. Levels of depression were measurd using
the Beck Depression Inventory the day after and at midweek. She had 2 hypotheses: between those who took
slcohol and those who took ecstasy, depression levels will be different the day after ( hypothesis 1 ) and mid-
week ( hypothesis 2). To test these hypotheses , we need to fit a model that compares the distribution in the
alcohol group to that in the ecstasy group.
There are two choices to compare the distribution in two conditions containing scores form different entitities
7.4.1 THEORY
The logic behind the Wilcoxon rank-sum and Mann-Whitney test is incredibly elegant.
,First, let’s imagine a scenario in which
there is no difference in depression
levels between ecstasy and alcohol
users. If you were to rank the data
ignoring the group to which a person
belonged from lowest to highest, if
there’s no difference between the
groups then you should find a similar
number of high and low ranks in each
group. If you would add up the ranks
you would get about the same number.
Now let’s imagine that the ecstasy group is more depressed than
the alcohol group. If you rank the scores, then you would expect more higher ranks in the ecstasy group and
more lower ranks to be in the alcohol group. When you would sum the ranks in each group, we’d expect the
sum of ranks to be higher in the ecstasy group than in the alcohol group.
The Mann-Whitney and Wilcoxon rank-sum test use this
principle. In fact, when the groups have unequal numbers of participant in them, the test statistics for the
Wilcoxon rank-sum test (Ws) is simply the sum of ranks in the group that contains the fewer people, when the
group sizes are equal it’s the value of the smaller summed rank.
How do we determine whether this test statistic is significant? It turns out that the mean ( ) and standard
error ( ) of this test statistic can be calculated from the sample size of each group ( n 1 is the sample size
of group 1 and n2 is the sample size of group 2 ).
Then the equation of the mean is: The equation of the Standard error is :
When having equal groups with 10 people each n1 and n2 are both 10. So the equations are:
and
If we know the test statistic, the mean test statistic and the standard error, then we can convert the test
statistic to a z-score using the equation:
We also know that we can use the table to ascertain a p-value for a z-score. The z-scores for the Sunday and
Wednesday depression scores are:
and
So there is a significant difference between the groups on the Wednesday, but not on Sunday.
, The Mann-Whitney test is basically the same, but uses a statistic U , which has a direct relationship with the
Wilcoxon test statistic. U is calculated using an equation in which n 1 and n2 are the sample sized of groups 1 and
2 respectively. And R1 is the sum of ranks for group 1 :
Four our data we’d get the following ( 10 people in each group, sum of ranks for group 1 ( ecstasy ) was 119.5
for Sunday and 151 for Wednesday:
7.4.4 OUTPUT FROM THE MANN-WHITNEY TEST
With all non-parametric tests, the
output contains a summary table. The
model viewer is divided into two panels:
the left-hand panel shows the summary
table of any analyses that you have
done, and the right-hand panel shows
the details of the analysis.
Underneath the graph a table shows the
test statistics for the Mann-Whitney
test , the Wilcoxon procedure and the
corresponding z-score. The rows labelled
asymptotic , sig. and exact sig. tell us the
probability that a test statistic of at least
that magniute would occur if there were
no differences in the group. The two p-
values are interpreted in the same way
but are computed differently.
7.4.6 WRITING THE RESULTS
For the Mann-Whitney test, report only the test statistic ( denoted by U ) and its significance. In keeping with
good practice , include the effect size and report exact values of p.
If you want to report Wilcoxon test rather than Mann-Whitney U statistic you could write
7.5 COMPARING TWO RELATED CONDITIONS: THE WILCOXON SIGNED-RANK TEST