lOMoARcPSD|44532475
Page 1 of 2 / Ideal for students seeking high-yield, exam-ready preparation and confidence for MATH 110 Quizzes Final Exam Portage Learning MATH 110 Quizzes Final Exam Portage Learning / questions & answers for quick study and test prep.
! MATH 110 Quizzes Final Exam - Requires Respondus LockDo…
Home
Final Exam - Requires Respondus LockDown Submission Details:
Account
Modules
Browser + Webcam Time: 120 minutes
Files
Ac!vity Current 0 out of 100
Due No due date Points 100 Ques!ons 10
Grades Score: *
Time Limit 120 Minutes Requires Respondus LockDown Browser
Courses Kept Score: 0 out of 100
Instruc!ons * Some ques!ons not yet graded
Calendar
The final exam is comprehensive in nature, and includes ques!ons from covering material
from all 10 modules.
Inbox
You may only have the following items when taking an exam: computer, 1-2 pieces of blank
scratch paper, a pen/pencil, and a calculator.
History
You may ONLY use the equa!on sheets that are provided WITHIN the exam. The use of
printed versions will be considered a viola!on of the Academic Integrity Policy.
Student
Dashboard
A"empt History
Help
A"empt Time Score
LATEST A"empt 1 120 minutes 0 out of 100 *
* Some ques!ons not yet graded
Score for this quiz: 0 out of 100 *
Submi"ed Jun 3 at 6:09pm
This a"empt took 120 minutes.
Ques!on 1 Not yet graded / 10 pts
You may find the following files helpful throughout the exam:
Sta!s!cs_Equa!on_Sheet
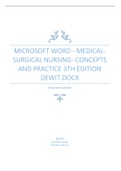
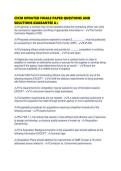
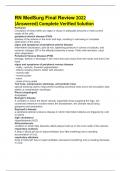
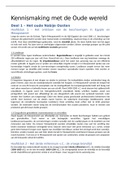
The following pie chart shows the percentages of total items sold
in a month in a certain fast food restaurant.
A total of 5300 fast food items were sold during the month.
a.)How many were burgers?
b.) How many were chickens?
Your Answer:
a.) 5300(.27)=1431
b.) 5300(.23)= 1219
a.) Burgers : 5300(.27) = 1431
b.)Chicken : 5300(.23) = 1219
Ques!on 2 Not yet graded / 10 pts
You may find the following files helpful throughout the exam:
Sta!s!cs_Equa!on_Sheet
Consider the following data:
437 389 414 401 466 421 399 387 450 407 392 410
440 417 488
Find the 60th percen!le of this data.
Your Answer:
the 9th nuhmber, 417, is the 60th percen!le
There are a total of fi#een numbers, so n= 15. In order to
find the percen!les, we must put the numbers in
ascending order:
387 389 392 399 401 407 410 414 417 421
437 440 450 466 488
For the 60th percen!le:
Therefore, the 60th percen!le index for this data set is
the 9th observa!on. In the list above, the 9th
observa!on is 417.
Ques!on 3 Not yet graded / 10 pts
You may find the following files helpful throughout the exam:
Sta!s!cs_Equa!on_Sheet
In a manufacturing plant, three machines A, B, and C produce 30
%, 20 %, and 50 %, respec!vely, of the total parts produc!on.
The company's quality control department determined that 3 %
of the parts produced by machine A, 2.5 % of the parts produced
by machine B, and 4 % of the parts produced by machine C are
defec!ve. If a part is selected at random and found to be
defec!ve, what is the probability that it was produced by
machine B?
Your Answer:
the probability that a part selected at random was defec!ve and
came from machine B is .1471
If we use Def to designate “defec!ve”.
We are told that given that a part was produced by
machine A, the probability that it has a defect is:
P(Def│A)=.03..
We are told that given that a part was produced by
machine B, the probability that it has a defect is:
P(Def│B)=.025.
We are told that given that a part was produced by
machine C, the probability that it has a defect is:
P(Def│C)=.04.
Furthermore, we are told that the probability that a part
was produced by machine A, B, and C, are respec!vely:
P(A)=.30,P(B)=.20,P(C)=.5.
We want to find P(B│Def), so use:
Ques!on 4 Not yet graded / 10 pts
You may find the following files helpful throughout the exam:
Sta!s!cs_Equa!on_Sheet
Standard Normal Table
Find each of the following probabili!es:
a. Find P(Z ≤ 1.27) .
b. Find P(Z ≥ -.73) .
c. Find P(-.09 ≤ Z ≤ .86).
Your Answer:
a. =.89796
b. =.95818
c. =.80511 - . 46414 = .34097
a.
P(Z ≤ 1.27)= .89796.
b.
P(Z ≥ -.73)=1- .23270= .7673 .
c.
P(-.09 ≤ Z ≤ .86)= .80511- .46414= .34097.
Ques!on 5 Not yet graded / 10 pts
You may find the following files helpful throughout the exam:
Sta!s!cs_Equa!on_Sheet
Standard Normal Table
Suppose that you are a"emp!ng to es!mate the annual income
of 1100 families. In order to use the infinite standard devia!on
formula, what sample size, n, should you use?
Your Answer:
In order to use infinite standard devia!on formula, we
should have:
n≤0.05(1100)
n≤55
So, the sample size should be less than 55.
Ques!on 6 Not yet graded / 10 pts
You may find the following files helpful throughout the exam:
Sta!s!cs_Equa!on_Sheet
Standard Normal Table
T Table
A shipment of 350 new blood pressure monitors have arrived.
Tests are done on 60 of the new monitors and it is found that 8
of the 60 give incorrect blood pressure readings. Find the 80%
confidence interval for the propor!on of all the monitors that
give incorrect readings.
Answer the following ques!ons:
1. Mul!ple choice: Which equa!on would you use to solve this
problem?
M6-MC-A.PNG
A.
M6-MC-B.PNG
B.
M6-MC-C.PNG
C.
M6-MC-D.PNG
D.
M6-MC-E.PNG
E.
2. List the values you would insert into that equa!on.
3. State the final answer to the problem
Your Answer:
1. equa!on E
2.
3. , the por!on of the total monitors that give
incorrect readings is between .181 and .079
We have a finite popula!on, so we will use Case 2:
E.
The propor!on of the sample that are defec!ve is 8/60 =
.1333 so we set P=.1333. As we men!oned previously,
we es!mate p by P. So, p=.1333. A total of 60 monitors
were tested, so n=60. Based on a confidence limit of 80
%, we find in table 6.1 that z=1.28. The total number of
monitors is 350, so set N=350. Now, we can subs!tute
all of these values into our equa!on:
.1333± .0512
So the propor!on of the total that are defec!ve is
between .0821 and .1845.
Ques!on 7 Not yet graded / 10 pts
You may find the following files helpful throughout the exam:
Sta!s!cs_Equa!on_Sheet
Standard Normal Table
It is recommended that pregnant women over eighteen years old
get 85 milligrams of vitamin C each day. The standard devia!on
of the popula!on is es!mated to be 12 milligrams per day. A
doctor is concerned that her pregnant pa!ents are not ge%ng
enough vitamin C. So, she collects data on 45 of her pa!ents and
finds that the mean vitamin intake of these 45 pa!ents is 81
milligrams per day. Based on a level of significance of α = .02, test
the hypothesis.
Your Answer:
le' tailed test, find z sa!sfying P(Z<z)=.02
, becuase -2.23 is less than
-2.05, we reject the null hypothesis
H0: μ=85 milligrams per day.
H1: μ<85 milligrams per day.
This is a le#-tailed test, so we must find a z that sa!sfies
P(Z<z)=.02. In the standard normal table, we find z.02 =
-2.05. For a le#-tailed test, we will reject the null
hypothesis if the z-score is less than -2.05.
We find the z-score:
No!ce that since the z-score is less than -2.05, we reject
the null hypothesis.
Ques!on 8 Not yet graded / 10 pts
You may find the following files helpful throughout the exam:
Sta!s!cs_Equa!on_Sheet
standard normal table
t-table
Suppose we have independent random samples of size n1 = 615
and n2 = 505. The propor!ons of success in the two samples are
p1= .53 and p2 = .45. Find the 90% confidence interval for the
difference in the two popula!on propor!ons.
Answer the following ques!ons:
1. Mul!ple choice: Which equa!on would you use to solve this
problem?
A.
B.
C.
D.
2. List the values you would insert into that equa!on.
3. State the final answer to the problem
Your Answer:
1. equa!on B
2.
3. , the interval is .12935,
.03065
From table 6.1, we see that 90% confidence corresponds
to z=1.645. No!ce that the sample sizes are each greater
than 30, so we may use eqn. 8.2:
B.
So, the interval is (.03065,.12935).
Ques!on 9 Not yet graded / 10 pts
You may find the following files helpful throughout the exam:
Sta!s!cs_Equa!on_Sheet
standard normal table
t-table
Cri!cal_values_chart
Compute the sample correla!on coefficient for the following
data:
Can you be 95% confident that a linear rela!on exists between
the variables? If so, is the rela!on posi!ve or nega!ve? Jus!fy
you answer.
Your Answer:
yes you can be 95% confident. there is a posi!ve linear
rela!onship because the absolute value of r = .9864 which is
greater than .87834 thus a posi!ve linear rela!onship exists
r= .9864 Sx = 2.7 Sy = 4.6.
Note that for n=5 and 95% we get a value from the chart
of .87834. The absolute of r is |r|=.9864, which is above
.87834. So a posi!ve linear rela!on exists.
Ques!on 10 Not yet graded / 10 pts
You may find the following files helpful throughout the exam:
Sta!s!cs_Equa!on_Sheet
standard normal table
t-table
Cri!cal_values_chart
Chi-square table
F_Distribu!on_Table_
A trucking company wants to find out if their drivers are s!ll alert
a'er driving long hours. So, they give a test for alertness to two
groups of drivers. They give the test to 395 drivers who have just
finished driving 4 hours or less and they give the test to 565
drivers who have just finished driving 8 hours or more. The
results of the tests are given below.
Passed Failed
Drove 4 hours or less 290 105
Drove 8 hours or more 350 215
Is there is a rela!onship between hours of driving and alertness?
(Do a test for independence.) Test at the 1 % level of significance.
Your Answer:
H0: driving hours and alertness are independent
H1: driving hours and alretness are not independent
DF=1
CV=6.635
passed failed totals
4 290
hours 105
(E= 395
or (E=131.67)
less (263.33)
8
hours 350 215
565
or (E=376.67) (E=188.33)
more
MATH 110 Quizzes Final Exam Portage Learning
totals 640 320 960
MATH 110 Quizzes Final Exam Portage Learning.pdf
Downloaded by madiba South Africa stuvia ()
rank higher on Stuvia
Page 1 of 2 / Ideal for students seeking high-yield, exam-ready preparation and confidence for MATH 110 Quizzes Final Exam Portage Learning MATH 110 Quizzes Final Exam Portage Learning / questions & answers for quick study and test prep.
! MATH 110 Quizzes Final Exam - Requires Respondus LockDo…
Home
Final Exam - Requires Respondus LockDown Submission Details:
Account
Modules
Browser + Webcam Time: 120 minutes
Files
Ac!vity Current 0 out of 100
Due No due date Points 100 Ques!ons 10
Grades Score: *
Time Limit 120 Minutes Requires Respondus LockDown Browser
Courses Kept Score: 0 out of 100
Instruc!ons * Some ques!ons not yet graded
Calendar
The final exam is comprehensive in nature, and includes ques!ons from covering material
from all 10 modules.
Inbox
You may only have the following items when taking an exam: computer, 1-2 pieces of blank
scratch paper, a pen/pencil, and a calculator.
History
You may ONLY use the equa!on sheets that are provided WITHIN the exam. The use of
printed versions will be considered a viola!on of the Academic Integrity Policy.
Student
Dashboard
A"empt History
Help
A"empt Time Score
LATEST A"empt 1 120 minutes 0 out of 100 *
* Some ques!ons not yet graded
Score for this quiz: 0 out of 100 *
Submi"ed Jun 3 at 6:09pm
This a"empt took 120 minutes.
Ques!on 1 Not yet graded / 10 pts
You may find the following files helpful throughout the exam:
Sta!s!cs_Equa!on_Sheet
The following pie chart shows the percentages of total items sold
in a month in a certain fast food restaurant.
A total of 5300 fast food items were sold during the month.
a.)How many were burgers?
b.) How many were chickens?
Your Answer:
a.) 5300(.27)=1431
b.) 5300(.23)= 1219
a.) Burgers : 5300(.27) = 1431
b.)Chicken : 5300(.23) = 1219
Ques!on 2 Not yet graded / 10 pts
You may find the following files helpful throughout the exam:
Sta!s!cs_Equa!on_Sheet
Consider the following data:
437 389 414 401 466 421 399 387 450 407 392 410
440 417 488
Find the 60th percen!le of this data.
Your Answer:
the 9th nuhmber, 417, is the 60th percen!le
There are a total of fi#een numbers, so n= 15. In order to
find the percen!les, we must put the numbers in
ascending order:
387 389 392 399 401 407 410 414 417 421
437 440 450 466 488
For the 60th percen!le:
Therefore, the 60th percen!le index for this data set is
the 9th observa!on. In the list above, the 9th
observa!on is 417.
Ques!on 3 Not yet graded / 10 pts
You may find the following files helpful throughout the exam:
Sta!s!cs_Equa!on_Sheet
In a manufacturing plant, three machines A, B, and C produce 30
%, 20 %, and 50 %, respec!vely, of the total parts produc!on.
The company's quality control department determined that 3 %
of the parts produced by machine A, 2.5 % of the parts produced
by machine B, and 4 % of the parts produced by machine C are
defec!ve. If a part is selected at random and found to be
defec!ve, what is the probability that it was produced by
machine B?
Your Answer:
the probability that a part selected at random was defec!ve and
came from machine B is .1471
If we use Def to designate “defec!ve”.
We are told that given that a part was produced by
machine A, the probability that it has a defect is:
P(Def│A)=.03..
We are told that given that a part was produced by
machine B, the probability that it has a defect is:
P(Def│B)=.025.
We are told that given that a part was produced by
machine C, the probability that it has a defect is:
P(Def│C)=.04.
Furthermore, we are told that the probability that a part
was produced by machine A, B, and C, are respec!vely:
P(A)=.30,P(B)=.20,P(C)=.5.
We want to find P(B│Def), so use:
Ques!on 4 Not yet graded / 10 pts
You may find the following files helpful throughout the exam:
Sta!s!cs_Equa!on_Sheet
Standard Normal Table
Find each of the following probabili!es:
a. Find P(Z ≤ 1.27) .
b. Find P(Z ≥ -.73) .
c. Find P(-.09 ≤ Z ≤ .86).
Your Answer:
a. =.89796
b. =.95818
c. =.80511 - . 46414 = .34097
a.
P(Z ≤ 1.27)= .89796.
b.
P(Z ≥ -.73)=1- .23270= .7673 .
c.
P(-.09 ≤ Z ≤ .86)= .80511- .46414= .34097.
Ques!on 5 Not yet graded / 10 pts
You may find the following files helpful throughout the exam:
Sta!s!cs_Equa!on_Sheet
Standard Normal Table
Suppose that you are a"emp!ng to es!mate the annual income
of 1100 families. In order to use the infinite standard devia!on
formula, what sample size, n, should you use?
Your Answer:
In order to use infinite standard devia!on formula, we
should have:
n≤0.05(1100)
n≤55
So, the sample size should be less than 55.
Ques!on 6 Not yet graded / 10 pts
You may find the following files helpful throughout the exam:
Sta!s!cs_Equa!on_Sheet
Standard Normal Table
T Table
A shipment of 350 new blood pressure monitors have arrived.
Tests are done on 60 of the new monitors and it is found that 8
of the 60 give incorrect blood pressure readings. Find the 80%
confidence interval for the propor!on of all the monitors that
give incorrect readings.
Answer the following ques!ons:
1. Mul!ple choice: Which equa!on would you use to solve this
problem?
M6-MC-A.PNG
A.
M6-MC-B.PNG
B.
M6-MC-C.PNG
C.
M6-MC-D.PNG
D.
M6-MC-E.PNG
E.
2. List the values you would insert into that equa!on.
3. State the final answer to the problem
Your Answer:
1. equa!on E
2.
3. , the por!on of the total monitors that give
incorrect readings is between .181 and .079
We have a finite popula!on, so we will use Case 2:
E.
The propor!on of the sample that are defec!ve is 8/60 =
.1333 so we set P=.1333. As we men!oned previously,
we es!mate p by P. So, p=.1333. A total of 60 monitors
were tested, so n=60. Based on a confidence limit of 80
%, we find in table 6.1 that z=1.28. The total number of
monitors is 350, so set N=350. Now, we can subs!tute
all of these values into our equa!on:
.1333± .0512
So the propor!on of the total that are defec!ve is
between .0821 and .1845.
Ques!on 7 Not yet graded / 10 pts
You may find the following files helpful throughout the exam:
Sta!s!cs_Equa!on_Sheet
Standard Normal Table
It is recommended that pregnant women over eighteen years old
get 85 milligrams of vitamin C each day. The standard devia!on
of the popula!on is es!mated to be 12 milligrams per day. A
doctor is concerned that her pregnant pa!ents are not ge%ng
enough vitamin C. So, she collects data on 45 of her pa!ents and
finds that the mean vitamin intake of these 45 pa!ents is 81
milligrams per day. Based on a level of significance of α = .02, test
the hypothesis.
Your Answer:
le' tailed test, find z sa!sfying P(Z<z)=.02
, becuase -2.23 is less than
-2.05, we reject the null hypothesis
H0: μ=85 milligrams per day.
H1: μ<85 milligrams per day.
This is a le#-tailed test, so we must find a z that sa!sfies
P(Z<z)=.02. In the standard normal table, we find z.02 =
-2.05. For a le#-tailed test, we will reject the null
hypothesis if the z-score is less than -2.05.
We find the z-score:
No!ce that since the z-score is less than -2.05, we reject
the null hypothesis.
Ques!on 8 Not yet graded / 10 pts
You may find the following files helpful throughout the exam:
Sta!s!cs_Equa!on_Sheet
standard normal table
t-table
Suppose we have independent random samples of size n1 = 615
and n2 = 505. The propor!ons of success in the two samples are
p1= .53 and p2 = .45. Find the 90% confidence interval for the
difference in the two popula!on propor!ons.
Answer the following ques!ons:
1. Mul!ple choice: Which equa!on would you use to solve this
problem?
A.
B.
C.
D.
2. List the values you would insert into that equa!on.
3. State the final answer to the problem
Your Answer:
1. equa!on B
2.
3. , the interval is .12935,
.03065
From table 6.1, we see that 90% confidence corresponds
to z=1.645. No!ce that the sample sizes are each greater
than 30, so we may use eqn. 8.2:
B.
So, the interval is (.03065,.12935).
Ques!on 9 Not yet graded / 10 pts
You may find the following files helpful throughout the exam:
Sta!s!cs_Equa!on_Sheet
standard normal table
t-table
Cri!cal_values_chart
Compute the sample correla!on coefficient for the following
data:
Can you be 95% confident that a linear rela!on exists between
the variables? If so, is the rela!on posi!ve or nega!ve? Jus!fy
you answer.
Your Answer:
yes you can be 95% confident. there is a posi!ve linear
rela!onship because the absolute value of r = .9864 which is
greater than .87834 thus a posi!ve linear rela!onship exists
r= .9864 Sx = 2.7 Sy = 4.6.
Note that for n=5 and 95% we get a value from the chart
of .87834. The absolute of r is |r|=.9864, which is above
.87834. So a posi!ve linear rela!on exists.
Ques!on 10 Not yet graded / 10 pts
You may find the following files helpful throughout the exam:
Sta!s!cs_Equa!on_Sheet
standard normal table
t-table
Cri!cal_values_chart
Chi-square table
F_Distribu!on_Table_
A trucking company wants to find out if their drivers are s!ll alert
a'er driving long hours. So, they give a test for alertness to two
groups of drivers. They give the test to 395 drivers who have just
finished driving 4 hours or less and they give the test to 565
drivers who have just finished driving 8 hours or more. The
results of the tests are given below.
Passed Failed
Drove 4 hours or less 290 105
Drove 8 hours or more 350 215
Is there is a rela!onship between hours of driving and alertness?
(Do a test for independence.) Test at the 1 % level of significance.
Your Answer:
H0: driving hours and alertness are independent
H1: driving hours and alretness are not independent
DF=1
CV=6.635
passed failed totals
4 290
hours 105
(E= 395
or (E=131.67)
less (263.33)
8
hours 350 215
565
or (E=376.67) (E=188.33)
more
MATH 110 Quizzes Final Exam Portage Learning
totals 640 320 960
MATH 110 Quizzes Final Exam Portage Learning.pdf
Downloaded by madiba South Africa stuvia ()
rank higher on Stuvia